Download
1 / 25
260 likes | 347 Views
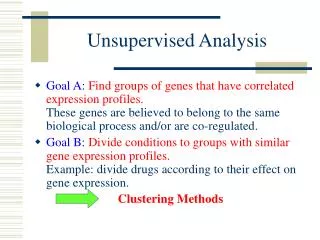
Unsupervised Analysis. Goal A: Find groups of genes that have correlated expression profiles. These genes are believed to belong to the same biological process and/or are co-regulated.

E N D
Unsupervised Analysis • Goal A:Find groups of genes that have correlated expression profiles.These genes are believed to belong to the same biological process and/or are co-regulated. • Goal B:Divide conditions to groups with similar gene expression profiles.Example: divide drugs according to their effect on gene expression. Clustering Methods
K-means: The Algorithm • Given a set of numeric points in d dimensional space, and integer k • Algorithm generates k (or fewer) clusters as follows: • Assign all points to a cluster at random • Compute centroid for each cluster • Reassign each point to nearest centroid • If centroids changed go back to stage 2
Step 1: Make random assignments and compute centroids (big dots) Step 2: Assign points to nearest centroids Step 3: Re-compute centroids (in this example, solution is now stable) K-means: Example, k = 3
Fuzzy K means • The clusters produced by the k-means procedure are sometimes called "hard" or "crisp" clusters, since any feature vector x either is or is not a member of a particular cluster. This is in contrast to "soft" or "fuzzy" clusters, in which a feature vector x can have a degree of membership in each cluster. • The fuzzy-k-means procedure allows each feature vector x to have a degree of membership in Cluster i:
Fuzzy K means Algorithm • Make initial guesses for the means m1, m2,..., mk • Until there are no changes in any mean: • Use the estimated means to find the degree of membership u(j,i) of xj in Cluster i; for example, if dist(j,i) = exp(- || xj - mi ||2 ), one might use u(j,i) = dist(j,i) / Sj dist(j,i) • For i from 1 to k • Replace mi with the fuzzy mean of all of the examples for Cluster i • end_for • end_until
K-means: Sample Application • Gene clustering. • Given a series of microarray experiments measuring the expression of a set of genes at regular time intervals in a common cell line. • Normalization allows comparisons across microarrays. • Produce clusters of genes which vary in similar ways over time. • Hypothesis: genes which vary in the same way may be co-regulated and/or participate in the same pathway. Sample Array. Rows are genes and columns are time points. A cluster of co-regulated genes.
Centroid Methods - K-means • Start with random position of K centroids. • Iteratre until centroids are stable • Assign points to centroids • Move centroids to centerof assign points Iteration = 3
Agglomerative Hierarchical Clustering • Results depend on distance update method • Single linkage: elongated clusters • Complete linkage: sphere-like clusters • Greedy iterative process • Not robust against noise • No inherent measure to choose the clusters
Gene Expression Data • Cluster genes and conditions • 2 independent clustering: • Genes represented as vectors of expression in all conditions • Conditions are represented as vectors of expression of all genes
First clustering - Experiments 1. Identify tissue classes (tumor/normal)
Second Clustering - Genes Ribosomal proteins Cytochrome C metabolism HLA2 2.Find Differentiating And Correlated Genes
Coupled Two-way Clustering (CTWC) • Motivation: Only a small subset of genes play a role in a particular biological process; the other genes introduce noise, which may mask the signal of the important players. Only a subset of the samples exhibit the expression patterns of interest. • New Goal: Use subsets of genes to study subsets of samples (and vice versa) • A non-trivial task – exponential number of subsets. • CTWC is a heuristic to solve this problem.
CTWC of Colon Cancer Data Tumor Normal (A) Protocol A Protocol B (B)
Multiple Testing Problem • Simultaneously test m null hypotheses, one for each gene j Hj: no association between expression measure of gene j and the response • Because microarray experiments simultaneously monitor expression levels of thousands of genes, there is a large multiplicity issue • Increased chance of false positives
Hypothesis Truth Vs. Decision Decision Truth
Strong Vs. Weak Control • All probabilities are conditional on which hypotheses are true • Strong control refers to control of the Type I error rate under any combination of true and false nulls • Weak control refers to control of the Type I error rate only under the complete null hypothesis (i.e. all nulls true) • In general, weak control without other safeguards is unsatisfactory
Adjusted p-values (p*) • Test level (e.g. 0.05) does not need to be determined in advance • Some procedures most easily described in terms of their adjusted p-values • Usually easily estimatedusing resampling • Procedures can be readily compared based on the corresponding adjusted p-values
A Little Notation • For hypothesis Hj, j = 1, …, m observed test statistic: tj observed unadjusted p-value: pj • Ordering of observed (absolute) tj: {rj} such that |tr1| |tr2| … |trG| • Ordering of observed pj: {rj} such that |pr1| |pr2| … |prG| • Denote corresponding RVs by upper case letters (T, P)
Control of the type I errors • Bonferroni single-stepadjusted p-values pj* = min (mpj, 1) • Sidak single-step (SS) adjusted p-values pj * = 1 – (1 – pj)m • Sidak free step-down (SD) adjusted p-values pj * = 1 – (1 – p(j))(m – j + 1)
Control of the type I errors • Holm (1979)step-down adjusted p-values prj* = maxk = 1…j {min ((m-k+1)prk, 1)} • Intuitive explanation: once H(1) rejected by Bonferroni, there are only m-1 remaining hyps that might still be true (then another Bonferroni, etc.) • Hochberg (1988) step-up adjusted p-values (Simes inequality) prj* = mink = j…m {min ((m-k+1)prk, 1) }
Control of the type I errors • Westfall & Young (1993) step-down minP adjusted p-values prj* = maxk = 1…j { p(maxl{rk…rm} Pl prkH0C )} • Westfall & Young (1993) step-down maxT adjusted p-values prj* = maxk = 1…j { p(maxl{rk…rm} |Tl| ≥ |trk| H0C )}
Westfall & Young (1993) Adjusted p-values • Step-down procedures: successively smaller adjustments at each step • Take into account the joint distribution of the test statistics • Less conservative than Bonferroni, Sidak, Holm, or Hochberg adjusted p-values • Can be estimated by resampling but computer-intensive (especially for minP)