Download
1 / 25
480 likes | 997 Views
Unsupervised Classification. Mirza Muhammad Waqar Contact: mirza.waqar@ist.edu.pk +92-21-34650765-79 EXT:2257. RG610. Course: Introduction to RS & DIP. Contents. Satellite Image Classification Spectral vs Spatial Pattern Recognition Feature Space Image Spectral Signature

E N D
Unsupervised Classification Mirza Muhammad Waqar Contact: mirza.waqar@ist.edu.pk +92-21-34650765-79 EXT:2257 RG610 Course: Introduction to RS & DIP
Contents • Satellite Image Classification • Spectral vs Spatial Pattern Recognition • Feature Space • Image Spectral Signature • Limitations in Classification • Unsupervised Classification • Clustering Algorithms • K-means Approach • ISODATA Model • Texture or Roughness Model • Post Classification
Satellite Image Classification • Automatic categorization of all pixel into land cover classes. • To explore different land covers in a satellite image. • To assign unique no or symbol to particular land cover. • Qualitative and Quantitative analysis of satellite image.
Spectral vs Spatial • Spectral pattern recognition Family of classification procedures that utilize pixel by pixel spectral information as the basis for automated land cover classification. • Spatial pattern recognition Categorization of image pixels on the basis of their spatial relationship with pixels surrounding them.
Satellite Image Classification • Three types of classifications • Un-Supervised Classification • Supervised Classification • Hybrid Classification
Limitations in Classification • Limitations face in satellite image classification • Pixel Size • All Statistical parameters are developed for normalized distribution.
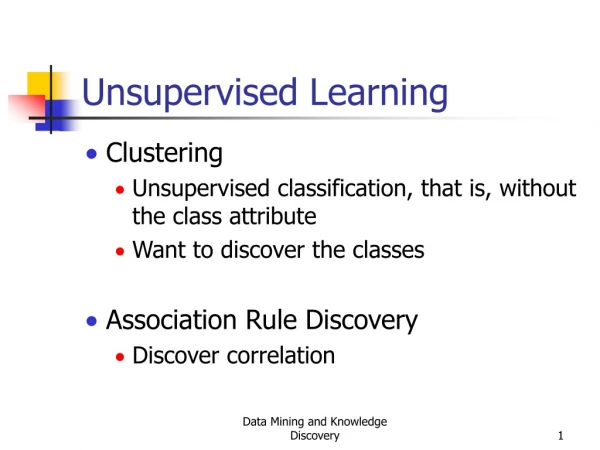
Un-Supervised Classification • Use to cluster pixels based on statistics only. • No user defined training classes required. • Machine based classification. • Post classification is of more importance to make results meaningful. • Incorporate all the natural groups in satellite image (spectral classes). • Un-supervised Classification have two phases. • Clustering • Post Classification
Clustering Algorithms • Numerous clustering algorithms • K-means Approach • ISODATA Model • Texture or Roughness Model
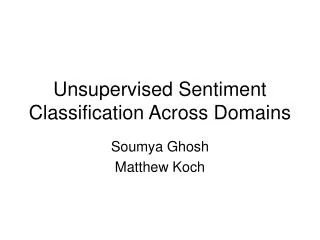
K-means Approach • Accept number of clusters to be located in the data. • Arbitrarily locate that number of cluster centers in multi-dimensional measurement space. • Each pixel is assigned to the cluster whose mean vector is closest.
Band B Band A
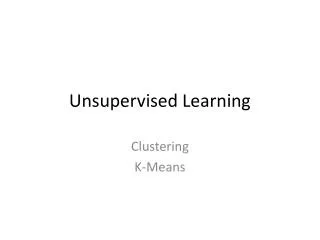
Band B New computed Means Previous Means Band A
Band B New computed Means Previous Means Band A
K-Mean Approach • New means are computed. • Revised clustering on the base of new computed means. • This process continue until there is no significant change in clusters mean.
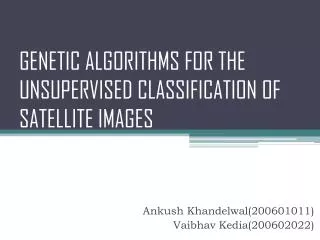
ISODATA Model • Iterative Self-Organizing Data Analysis. • Follow K-mean principle for clustering. • Accept number of clutters, number of iterations & convergence tolerance from the user and form clusters. • Permits number of clusters to change from one iteration to the next, by merging, splitting and deleting clusters based on spatial statistics and user defined conditions.
Band B New computed Means Previous Means Band A
Texture or Roughness Model • It incorporate a sensitivity to image “texture” or “roughness” as a basis for establishing clusters centers. • Texture is computed through multi-dimensional variance observed in moving window (e.g. a 3x3 window). • Analyst sets a variance threshold below which window is consider “smooth” and above which it is considered “rough”.
Texture or Roughness Model • The mean of the first smooth window encountered in the image becomes the first cluster center. • The mean of the second smooth window encountered in the image becomes the second cluster center and so forth. • This process continue until the user defined no of clusters reached.
Post Classification • In post classification phase, analyst compare spectral classes with some reference data to determine the identify of the spectral classes. • Spectral reflectance curves can be used to identify the spectral classes. • Defining the level of classification • Merging different classes to reach final outcome. • Accuracy assessment through field truthing.