Download
1 / 1
10 likes | 109 Views
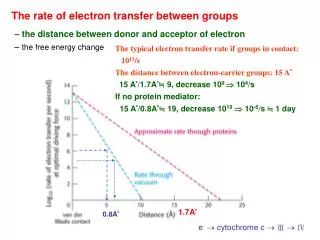
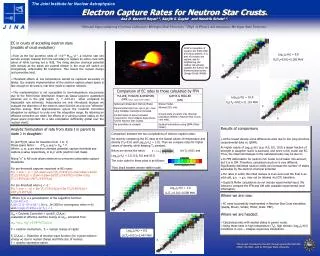
Neutron star EXO 0748-676 (blue sphere) is part of a binary star system, and its neighboring star (yellow-red sphere) supplies the fuel for the thermonuclear bursts. (Image Credit: NASA). Log 10 ( Ye) = 8.0. Log 10 ( Ye) = 9.0. Log 10 ( Ye) = 10.0. Log 10 ( Ye) = 1.0. Z. N.

E N D
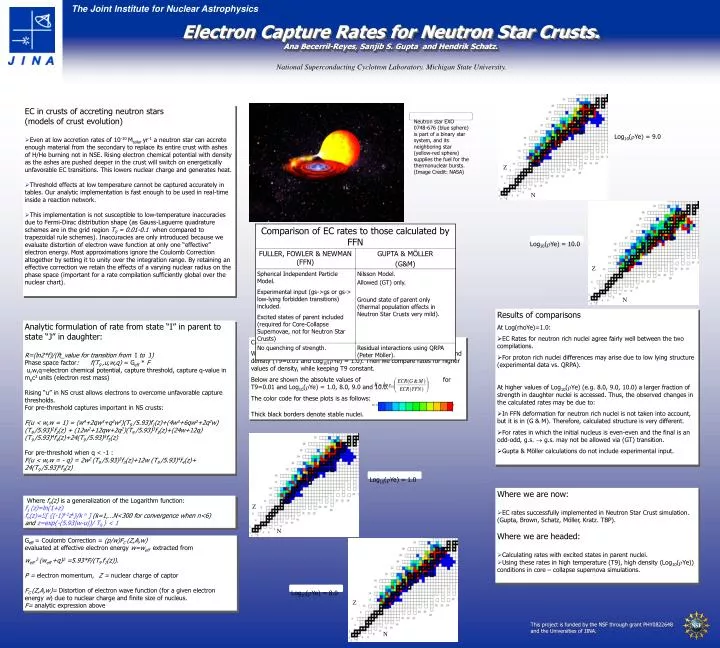
Neutron star EXO 0748-676 (blue sphere) is part of a binary star system, and its neighboring star (yellow-red sphere) supplies the fuel for the thermonuclear bursts. (Image Credit: NASA) Log10(Ye) = 8.0 Log10(Ye) = 9.0 Log10(Ye) = 10.0 Log10(Ye) = 1.0 Z N Electron Capture Rates for Neutron Star Crusts.Ana Becerril-Reyes, Sanjib S. Gupta and Hendrik Schatz. National Superconducting Cyclotron Laboratory. Michigan State University. • EC in crusts of accreting neutron stars • (models of crust evolution) • Even at low accretion rates of 10-10 Msolar yr-1 a neutron star can accrete enough material from the secondary to replace its entire crust with ashes of H/He burning not in NSE. Rising electron chemical potential with density as the ashes are pushed deeper in the crust will switch on energetically unfavorable EC transitions. This lowers nuclear charge and generates heat. • Threshold effects at low temperature cannot be captured accurately in tables. Our analytic implementation is fast enough to be used in real-time inside a reaction network. • This implementation is not susceptible to low-temperature inaccuracies due to Fermi-Dirac distribution shape (as Gauss-Laguerre quadrature schemes are in the grid region T9 = 0.01-0.1 when compared to trapezoidal rule schemes). Inaccuracies are only introduced because we evaluate distortion of electron wave function at only one “effective” electron energy. Most approximations ignore the Coulomb Correction altogether by setting it to unity over the integration range. By retaining an effective correction we retain the effects of a varying nuclear radius on the phase space (important for a rate compilation sufficiently global over the nuclear chart). Z N Z N Results of comparisons At Log(rhoYe)=1.0: • EC Rates for neutron rich nuclei agree fairly well between the two compilations. • For proton rich nuclei differences may arise due to low lying structure (experimental data vs. QRPA). At higher values of Log10(Ye) (e.g. 8.0, 9.0, 10.0) a larger fraction of strength in daughter nuclei is accessed. Thus, the observed changes in the calculated rates may be due to: • In FFN deformation for neutron rich nuclei is not taken into account, but it is in (G & M). Therefore, calculated structure is very different. • For rates in which the initial nucleus is even-even and the final is an odd-odd, g.s. g.s. may not be allowed via (GT) transition. • Gupta & Möller calculations do not include experimental input. Analytic formulation of rate from state “I”in parent to state“J”in daughter: R=(ln2*f)/(ft_value for transition from I to J) Phase space factor: f(T9 ,u,w,q) = Geff * F u,w,q=electron chemical potential, capture threshold, capture q-value in mec2 units (electron rest mass) Rising “u” in NS crust allows electrons to overcome unfavorable capture thresholds. For pre-threshold captures important in NS crusts: F(u < w,w = 1) = (w4+2qw3+q2w2)(T9 /5.93)f1(z)+(4w3+6qw2+2q2w) (T9 /5.93)2f2(z) + (12w2+12qw+2q2)(T9 /5.93)3f3(z)+(24w+12q) (T9 /5.93)4f4(z)+24(T9 /5.93)5f5(z) For pre-threshold when q < -1 : F(u < w,w = - q) = 2w2 (T9 /5.93)3f3(z)+12w (T9 /5.93)4f4(z)+ 24(T9 /5.93)5f5(z) Comparison between the two compilations of electron capture rates: We start by comparing the EC rates at the lowest values of temperature and density (T9=0.01 and Log10(Ye) = 1.0). Then we compare rates for higher values of density, while keeping T9 constant. Below are shown the absolute values of for T9=0.01 and Log10(Ye) = 1.0, 8.0, 9.0 and 10.0. The color code for these plots is as follows: R= 0.001 0.1 0.2 0.3 0.4 0.5 0.6 0.7 0.8 0.9 R1.0 Thick black borders denote stable nuclei. • Where we are now: • EC rates successfully implemented in Neutron Star Crust simulation. (Gupta, Brown, Schatz, Möller, Kratz. TBP). Where we are headed: • Calculating rates with excited states in parent nuclei. • Using these rates in high temperature (T9), high density (Log10(Ye)) conditions in core – collapse supernova simulations. Where fn(z) is a generalization of the Logarithm function: f1 (z)=ln(1+z) fn(z)=[ {(-1)k-1zk}/k n ] (k=1,…N<300 for convergence when n<6) and z=exp{-(5.93|w-u|)/ T9 } < 1 Geff = Coulomb Correction = (p/w)FC (Z,A,w) evaluated at effective electron energy w=weff extracted from weff 2 (weff +q)2 =5.93*F/(T9 f1(z)). P = electron momentum, Z = nuclear charge of captor FC (Z,A,w)= Distortion of electron wave function (for a given electron energy w) due to nuclear charge and finite size of nucleus. F= analytic expression above Z N