Download
1 / 18
190 likes | 308 Views
Mass and Volume Contribution to Twentieth-century Global Sea Level Rise. L. Miller & B. C. Douglas. Nature vol. 428, 2004. Could water world really happen?. Interaction of temperature change with environmental system. Greenland Ice Sheet 7m GSLR. Antarctic+ GLIS 80m GSLR.

E N D
Mass and Volume Contribution to Twentieth-century Global Sea Level Rise L. Miller & B. C. Douglas Nature vol. 428, 2004
Could water world really happen? Interaction of temperature change with environmental system Greenland Ice Sheet 7m GSLR Antarctic+ GLIS 80m GSLR Water held in glaciers and small ice caps!!
Temperature and salinity variations But by how much ? • Volume Change (Total Steric Sea Level, TSSL) 2. Mass Change (Eustatic change) Exchange of water with atmosphere and continents
Gauge Data Isostatic Changes Total Steric Changes + Eustatic Changes
Dynamic Height Depth difference between two surfaces of constant pressure and gravity. It is derived from hydrographic data (T, S, P) Ocean General Circulation Models (OGCM)
Different Approaches Topex/ Poseidon data from 1993-2001 (Cabanes et al., 2001) Yearly average trend 1993-98 (3.2 + 0.2 mm/yr) TSC (temperature) (0-500m) 1993-98 (3.1 + 0.4mm/yr) Residual sea level (0.2 + 0.2 mm/yr) 5 year data trend
*Global mean TSC (0-3000m) (0.5 + 0.05 mm/yr) *Pseudo global mean TSC using data of 25 gauge sites (1.4 + 0.2 mm/yr) *PSMSL record at 25 tide gauge sites (1.6+0.15 mm/yr) *TSSL= 0.55 + 0.07 mm/yr *HSC 0.05 + 0.02 mm/yr *470 + 170 km3/yr fresh water *Mass increase 1.35+0.5 mm/yr (Antonov et al., 2002)
+ CG = 0.2-0.4 mm/yr TSC = 0.7 mm/yr MC = -0.2-0.6 mm/yr 0 Sum = -0.8 –2.2 mm/yr Avg = 0.7 mm/yr TWS = -1.1- 0.4 mm/yr - 3rd IPCC report (2001) IPCC adopted best estimates = 1.5 + 0.5 mm/yr
Comparison of hydrographic and tide gauge measured sea level change in the Eastern Pacific TSSL = 0.5 mm/yr Gauge data = 2 mm/yr
Local comparison a. 0.5 mm/yr b. 0.3 mm/yr • 0.9 mm/yr • Gauge data = 1.7 mm/yr
Regional comparison in the Eastern N. Atlantic TSSL = 0.2 mm/yr Gauge data = 2.1 & 1.9 mm/yr
Regional comparison in the Western N. Atlantic Gauge data =1.9 mm/yr Cabanes etal., 2001 8 sites = 0.5 mm/yr 1 site = 6.7 mm/yr (NA) Avg = 1.2 mm/yr
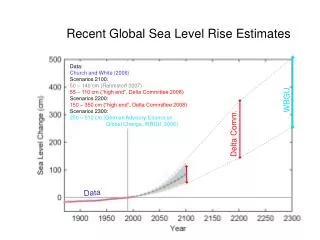
Conclusions *Overall gauge data = 1.5- 2.0 mm/yr GSLR for 20th century Hydrographic data = 0.5 mm/yr Mass Increase due to freshening = 1.4 mm/yr * Satellite data = 2.5 mm/yr (1993-2003) Decadal data !!
Volume of fresh water = (325 + 105) Km3/yr Ocean freshening, sea level rising, sea ice melting P. Wadhams, W. Munk (GRL., Vol. 31, 2004) Arctic Sea Ice melting = (625 + 125) Km3/yr Antarctic Ice thickening = (90 + 3) Km3/yr GSLR = mass + volume 0.6 + 0.5 = 1.1 mm/yr
Total steric sea level change 1.Thermosteric change (TC) 2. Halosteric change (SC)
Mass and Volume L. Miller & B. C. Douglas Nature vol. 428 2004