Download
1 / 16
160 likes | 363 Views
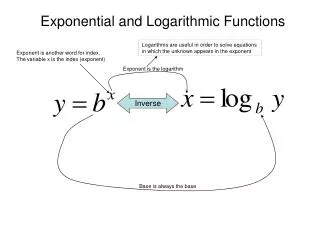
Exponential and Logarithmic Functions. By: LaShonda Green CTSE 5040 Fall 2009. Objectives. Graphing exponential and logarithmic functions Rational exponents Evaluating logarithms Solving exponential equations. Technology is important!.

E N D
Exponential and Logarithmic Functions By: LaShonda Green CTSE 5040 Fall 2009
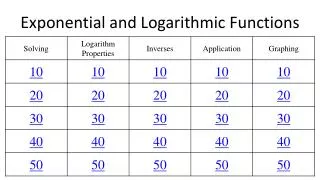
Objectives • Graphing exponential and logarithmic functions • Rational exponents • Evaluating logarithms • Solving exponential equations
Technology is important! • Principles and Standards states that “Technology is essential in teaching and learning mathematics; it influences the mathematics that is taught and enhances students’ learning.”
Types of Technology • Graphing Calculator • Online activities • Smart boards • excel
Graphing Calculators • Calculate logarithms • Graph exponential functions • Comparing different logarithmic graphs
Evaluating Logarithms on the TI-84 Plus ACTIVITY OVERVIEW: Understanding patterns, relations and functions. In this activity we will • Use the Y= register, table and graph to examine the relationship between y=10x and y=log(10x) • Evaluate logs in the table and on the home screen • Evaluate logs with base other than 10
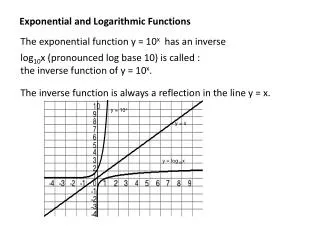
What exactly is the log or logarithm function? To learn about it, enter the equations y=10x and y=log(10x) into the y= register. Next Press 2nd Graph to view the table. What do you notice about the numbers in the three columns? What is the value of 103? What is the value of log (103)? Activity continued…
Set the window in order to view the graph. Press Window. Set the window as shown. Press Graph. Why does the graph of y=log(10x) appear to be the same as the graph of y=x? Press 2nd Window. Set the table to examine what happens for negative values of x (negative exponents) and for fractional values of x. Do the relationships noticed earlier remain the same? Activity continued…
Press 2nd Mode to return to the home screen. Use LOG to evaluate log(100). Because 102=100, the calculation returns a value of 2. Try finding the exponent for other values of 10x such as log(64) as shown. What happens if the base of your exponential function is not 10? How does that affect the log? Press y= and clear the previous equations. Enter y=4x as shown. Activity continued…
Press 2nd Graph to view the table. What is the value of 43? What is the value of 44? Press 2nd Mode to return to the home screen. Use LOG to evaluate log464. Use the change-of-base property for logarithms, which says logba= log a/log b. How do these results match the results in the table above? Activity continued…
Online Activities • The following websites have great activities for math teachers. • www.explorelearning.com • www.illuminations.nctm.org • www.education.ti.com • There are also websites that can help reinforce what the students have learned for example • www.wolframalpha.com
Online Activity • Link: http://teachers.henrico.k12.va.us/math/HCPSAlgebra2/10-1.htm • This activity allows students to manipulate the variables in a exponential graph. This also graphs the asymptotes and the x and y intercept.
Other types of technology • Smart boards are great tools that can be used in the classroom. • Smart boards can be used when students are not in access to a computer. • This board can show graphs and other visuals and show online activities that the students can do as a class.
Excel • Calculate logarithms • Make Graphs • Make Tables of values
How does technology help? • Great Visuals • Enhance learning • Different perspective
Resources • NCTM, (2008). Principles and standards for school mathematics. • www.wolframalpha.com • www.illuminations.nctm.org • www.education.ti.com • www.explorelearning.com • http://teachers.henrico.k12.va.us/math/HCPSAlgebra2/10-1.htm • http://www.team-math.net/curriculum/index.htm