Download
1 / 60
600 likes | 755 Views
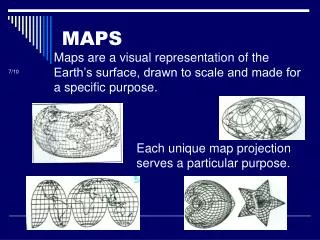
Maps. Three sources of map distortion. Map scale – most maps are smaller than the reality they represent. Map scales tell us how much smaller. Map projection – this occurs because you must transform the curved surface of the earth on a flat plane.

E N D
Three sources of map distortion • Map scale – most maps are smaller than the reality they represent. Map scales tell us how much smaller. • Map projection – this occurs because you must transform the curved surface of the earth on a flat plane. • Map type – you can display the same information on different types of maps.
Map scale – tells us relationship between distance on map and distance on earth’s surface • Ratio scale = ratio of map distance to earth distance. • 1:10,000 means that one inch on the map equals 10,000 inches earth’s surface; one centimeter represents 10,000 centimeters; or one foot equals 10,000 feet. • Recall a small fraction has a large denominator so that 1:100,000 is a smaller scale than 1:25,000. • A large-scale map depicts a small area with great detail. • A small-scale map depicts a larger area with little detail. Distortion is especially severe here.
Which is the large-scale map? A. B. C. D.
Which map scale shows the most detail? a. 1:250,000 b. 1:24,000 c. 1:100,000 d. 1:62,500 • A map with a large scale usually shows a. a large amount of land space b. a small amount of land space c. physical features only of a land space d. the local-global continuum e. political boundaries between countries only
Map scale – tells us relationship between distance on map and distance on earth’s surface • Ratio scale = ratio of map distance to earth distance. • 1:10,000 means that one inch on the map equals 10,000 inches earth’s surface; one centimeter represents 10,000 centimeters; or one foot equals 10,000 feet. • Recall a small fraction has a large denominator so that 1:100,000 is a smaller scale than 1:25,000. • A large-scale map depicts a small area with great detail. • A small-scale map depicts a larger area with little detail. Distortion is especially severe here.
location, direction, distancesite and situation The starting point for a geographer (After the map…)
Absolute Direction Absolute Distance Absolute Location Relative Direction Relative Distance Relative Location Some Vocab: • Toponym • Site • Situation
Toponym • Place Name!
Absolute locationmathematical location • Clemmons is: • 36o 01’ 17.30” N (longitude) • 80o 22’ 55.15” W (latitude) • 700 building • 36o 03’ 48.84” N • 80o 22’ 55.15“ W
Siteinternal physical attributes • (includes absolute location, but includes the physical setting; especially in urban geography) • Clemmons is bordered on the West by the Yadkin River
Relative locationregional position relative to other places • (general spatial interconnection and interdependence) • Clemmons is in the northwest piedmont section of Forsyth County • Davidson County is to the south • Davie County (Advance) is to the west • Winston-Salem is 10 miles to the east • Exit off I-40 & Hwy 421
Situationexternal location attributes • (external relations, a type of relation location that refers to items of significance, especially in urban geography) • Suburb of Winston-Salem, a bedroom community for persons working in the medical, bio technical/medical and aeronautical businesses in the Triad • I-40 and US 421, major transportation
Absolute directioncardinal points N-S-E-W • Clemmons is southwest of Winston-Salem.
Relative directionculturally based, not necessarily an accurate cardinal point • Clemmons is in the “South”. • Clemmons is …
Absolute distancemathematical space between 2 points • Clemmons is 10 miles (16km) from Winston-Salem.
Relative distancemeaningful space measurement • Clemmons is about 15 minutes from Winston-Salem. • Clemmons is one hour from Mt. Airy.
Use the terms… 1. Describe the absolute location, absolute direction and absolute distance of a place of your choice. 2. Describe the relative location, relative direction and relative distance of the same place. 3. Describe the site. 4. Describe the situation.
Which of the following is not a measure of relative distance? a. 2,339 cm b. 35 seconds c. $2.50 cab ride d. 216 footsteps e. 15 minutes • Relative location is an important geographic concept mainly because it a. locates places according to longitude and latitude b. defines a place in terms of how central or isolated it is to other places c. defines patterns of natural environment d. helps cartographers to develop more accurate maps e. illustrates how local, regional and global factors interact within the local-global continuum
Who demonstrated the Earth was round using maps? a. Ptolemy b. Aristotle c. Eratosthenes d. Sauer • Who coined the word geography? a. Ptolemy b. Aristotle c. Eratosthenes d. Sauer
Evolution of Mapmaking • Babylonians – 2300 BC earliest surviving maps written on clay tablets. • Aristotle – 384-322 BC demonstrated earth was spherical through maps. • Eratosthenes – 276-194 BC first person to use the word geography. Also the first person to correctly divide earth into 5 climatic regions. • Ptolemy – 100-170 AD Guide to Geography • Age of Exploration – by the 17th century, most continents and oceans were accurately displayed.
Contemporary Mapping • GIS (geographic information systems) • GPS (global positioning system) • Remote Sensing Satellites
a. Remote Sensing b. GPS c. GIS d. DTM • Layers of geographical information that can be selected or deselected when viewing a map • Can immediately scan the Earth’s surface to determine changes in geography
Remote Sensing • The acquisition of data about Earth’s surface remotely such as from an airplane or satellite orbiting the planet. • Primarily environmental mapping – vegetation, surface cover, winter ice cover, deforestation
http://www.nytimes.com/interactive/2011/03/13/world/asia/satellite-photos-japan-before-and-after-tsunami.html?_r=0http://www.nytimes.com/interactive/2011/03/13/world/asia/satellite-photos-japan-before-and-after-tsunami.html?_r=0 • http://eijournal.com/2011/disaster-response-in-japan-2 Satellite images of the north-east coast of Japan before (left) and after the earthquake and tsunami. Water is black or dark blue and the thin green line in the 'after' image indicates the shoreline. Photograph: Nasa
Map Grid • Latitude /Longitude • Tropics • Equator • Prime Meridian /International Date Line
Gain a Day Skip a Day
Immediately to the left of the International Date Line, the date is always one day ahead of the date immediately to the right of the International Date Line. On the time and date codes shown below, note that Tonga and Samoa have the exact same time, but are actually one day apart, as Samoa is in the Western Hemisphere (to the east of the dateline) and Tonga is in the Eastern Hemisphere. In summary, travel west across the International Date Line and you will gain a day, travel east across it and you will lose a day.
All Maps should Have • Cartographer • Title • Scale • Key
How to Lie with maps • A map is a generalization or representation of the real world. • Cartography – the science of mapmaking. • All maps lie flat and all maps lie. They contain distortions. You cannot represent the three-dimensional earth on a flat surface without distorting reality. • Any useful map is selective in what is put in and left out. Example: road or subway map.
Three sources of map distortion • Map scale – most maps are smaller than the reality they represent. Map scales tell us how much smaller. • Map projection – this occurs because you must transform the curved surface of the earth on a flat plane. • Map type – you can display the same information on different types of maps.
Map Type – you can display the same information on different maps • Types of maps: • Dot – each dot represents some frequency • Isoline – connects points of equal value • Choropleth – puts features into classes and then maps classes for each region • Cartogram – adjusts the size of the country corresponds to the magnitude of the mapped feature • Proportional symbol – size of the symbol corresponds to the magnitude of the mapped feature
Dot – each dot represents some frequency Chart Map
Students applauding at Lecture Key: desk incidents of applauding Scale 1:9 Cartographer: D. Troxell
Choropleth – puts features into classes and then maps classes for each region
Proportional symbol – size of the symbol corresponds to the magnitude of the mapped feature
Cartogram – adjusts the size of the country corresponds to the magnitude of the mapped feature http://www.worldmapper.org/
Other Thematic Maps- spatial distribution of one or more specific themes