Download
1 / 9
90 likes | 230 Views
Effects of Reuse on Quality, Productivity and Economics. Wayne C. Lim, 1994. Manufacturing Productivity (MP) section of HP Produces software for resource planning Reuse: Started in 1983 Reuse of code, applications, architecture utilities Code in Pascal and SPL.

E N D
Effects of Reuse on Quality, Productivity and Economics Wayne C. Lim, 1994
Manufacturing Productivity (MP) section of HP Produces software for resource planning Reuse: Started in 1983 Reuse of code, applications, architecture utilities Code in Pascal and SPL San Diego Technical Graphics Division Produces firmware for plotters and printers Reuse: Started in 1987 Reuse of code in C Two Case Studies
Result: Reuse Assessment • An analytical and diagnostic method to evaluate qualitative and quantitative aspects of reuse is developed. • Data on improved quality, productivity and economics is analyzed.
1. Quality Improvement • Reuse gave 2-4 times reduction in number of defects. Reasons are: • Defects found in each reuse are accumulated. • Reuse gives incentives to prevent defects earlier. • Cost of prevention may be averaged over a greater number of products.
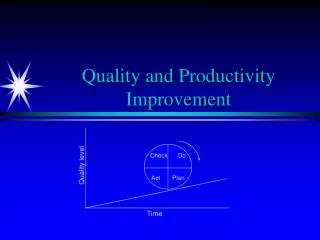
2. Productivity • Reuse encourages specialization in areas as use interfaces, etc. • Fewer products are created from scratch. • Reuse can improve maintainability and reduce maintenance costs. • MP experienced 57% increase, STG about 40%.
3. Time to Market • If reuse used on the critical path of development, time to market is reduced. • STG experienced 42% reduction.
Reuse costs (1) • Includes creating or purchasing • Reuse work products • Libraries • Tools • Reuse process • Integration costs
Reuse costs (2) • Findings show that relative cost of producing a reusable work product is 120-480 percent higher due to: • time to required to understand the multiple contexts in which the product is used. • More complex design • Integration cost of about 20%.
Net-present-value method • Take the estimated value of reuse benefits and subtract the associated costs, taking into account the time value of the money. • MP found that the break-even (recover costs) point occurs in the second year. Return on investment was 422% over 8 years. • STG found the break-even point in the sixth year, return on investment 216%.