Download

1 / 18
350 likes | 882 Views
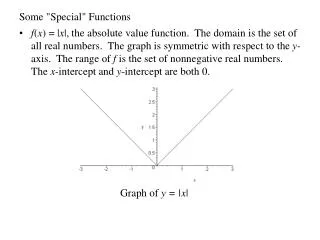
Special Functions. Constant Function ex. y = 4.95 The Charlie’s Smorgasbord Function Absolute Value Function ex. y = | x | absolute V alue Step (Greatest Integer) Function ex. y = [ x ] The Bob Barker “Price is Right” Function Piece-wise Function

E N D
Special Functions • Constant Function ex. y = 4.95 The Charlie’s Smorgasbord Function • Absolute Value Function ex. y = | x | absolute Value • Step (Greatest Integer) Function ex. y = [ x ] The Bob Barker “Price is Right” Function • Piece-wise Function ex. Made up of pieces!
Lesson 6 Contents Example 1Step Function Example 2Constant Function Example 3Absolute Value Functions Example 4Piecewise Function Example 5Identify Functions
Example 6-1a Psychology One psychologist charges for counseling sessions at the rate of $85 per hour or any fraction thereof. Draw a graph that represents this solution. Explore The total charge must be a multiple of $85, so the graph will be the graph of a step function. Plan If the session is greater than 0 hours, but less than or equal to 1 hour, the cost is $85. If the time is greater than 1 hour, but less than or equal to 2 hours, then the cost is $170, and so on.
x C(x) 85 170 255 340 425 Example 6-1b Solve Use the pattern of times and costs to make a table, where x is the number of hours of the session and C(x) is the total cost. Then draw the graph.
Answer: Example 6-1c Examine Since the psychologist rounds any fraction of an hour up to the next whole number, each segment on the graph has a circle at the left endpoint and a dot at the right endpoint.
Answer: Example 6-1d Sales The Daily Grind charges $1.25 per pound of meat or any fraction thereof. Draw a graph that represents this situation.
Graph Answer: For every value of The graph is a horizontal line. Example 6-2a
Graph Answer: Example 6-2b
Graph and on the same coordinate plane. Determine the similarities and differences in the two graphs. Example 6-3a Find several ordered pairs for each function.
The range of both graphs is Example 6-3b Graph the points and connect them. Answer: • The domain of both graphs is all real numbers. • The graphshave the same shape,but different x-intercepts. • The graph of g(x) is the graph of f(x) translated left 5units.
Graph and on the same coordinate plane. Determine the similarities and differences in the two graphs. Answer: • The domain of both graphs is all real numbers. • The range of is The range of is • The graphshave the same shape,but different y-intercepts. • The graph of g(x) is the graph of f(x)translated up 5units. Example 6-3c
Graph Identify the domain and range. Step 1 Graph the linear function forSince 3 satisfies this inequality, begin with a closed circle at (3, 2). Example 6-4a
Graph Identify the domain and range. Step 2 Graph the constant function Since x doesnot satisfy this inequality, begin with an open circle at (3, –1) and draw a horizontal ray to the right. Example 6-4b
Graph Identify the domain and range. Answer: The function is definedfor all values of x, so the domainis all real numbers. The valuesthat are y-coordinates of points on the graph are all real numbersless than or equal to –2, so therange is Example 6-4c
Graph Identify the domain and range. Answer: The domain is all realnumbers. The rangeis Example 6-4d
Example 6-5a Determine whether the graphrepresents a step function, a constant function, anabsolute value function, or a piecewise function. Answer: Since this graphconsists of differentrays and segments, it is a piecewisefunction.
Example 6-5b Determine whether the graphrepresents a step function, a constant function, anabsolute value function, or a piecewise function. Answer: Since this graph is V-shaped, it is an absolute value function.
Determine whether each graph represents a step function, a constant function, an absolute value function, or a piecewise function. a. b. Example 6-5c Answer: absolute valuefunction Answer: constant function