Download
1 / 40
470 likes | 725 Views
Relations and Functions Special Functions. AL 2HN CCSS:F.IF.2; F.IF.7. CCSS: F.IF.2 & F.IF.7. USE function notation , EVALUATE functions for inputs in their domains , and INTERPRET statements that use function notation in terms of a context. F.IF.7.

E N D
Relations and FunctionsSpecial Functions AL 2HN CCSS:F.IF.2; F.IF.7
CCSS: F.IF.2 & F.IF.7 • USE function notation, EVALUATE functions for inputs in their domains, and INTERPRET statements that use function notation in terms of a context.
F.IF.7 • GRAPH functions expressed symbolically and SHOW key features of the graph, by hand in simple cases and using technology for more complicated cases. • a. GRAPH linear and quadratic functions and SHOW intercepts, maxima, and minima. • b. GRAPH square root, cube root, and piecewise-defined functions, including step functions and absolute value functions. • c. GRAPH polynomial functions, IDENTIFYING zeros when suitable factorizations are available, and showing end behavior. • e. Graphexponential and logarithmic functions, SHOWING intercepts and end behavior, and trigonometric functions, showing period, midline, and amplitude.
ESSENTIAL QUESTION: • What is a function, and how do I determine if a relationship between two variables is a function? • How do the mathematical symbols in a function determine its graph? • What is the domain and range of a function given its graph?
Mathematical Practice 1. Make sense of problems, and persevere in solving them. 2. Reason abstractly and quantitatively. 3. Construct viable arguments, and critique the reasoning of others. 4. Model with mathematics. 5. Use appropriate tools strategically. 6. Attend to precision. 7. Look for, and make use of, structure. 8. Look for, and express regularity in, repeated reasoning.
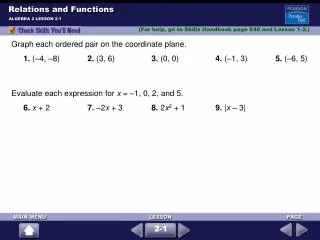
2-1: Graphing Linear Relations and Functions Objectives: • Understand, draw, and determine if a relation is a function. • Graph & write linear equations, determine domain and range. • Understand and calculate slope.
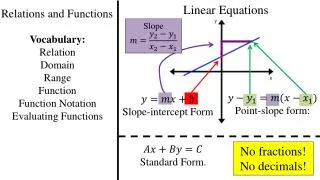
Relations & Functions Relation: a set of ordered pairs Domain: the set of x-coordinates Range: the set of y-coordinates When writing the domain and range, do not repeat values.
Relations and Functions Given the relation: {(2, -6), (1, 4), (2, 4), (0,0), (1, -6), (3, 0)} State the domain: D: {0,1, 2, 3} State the range: R: {-6, 0, 4}
Relations and Functions • Relations can be written in several ways: ordered pairs, table, graph, or mapping. • We have already seen relations represented as ordered pairs.
Table {(3, 4), (7, 2), (0, -1), (-2, 2), (-5, 0), (3, 3)}
Mapping • Create two ovals with the domain on the left and the range on the right. • Elements are not repeated. • Connect elements of the domain with the corresponding elements in the range by drawing an arrow.
2 1 0 3 -6 4 0 Mapping {(2, -6), (1, 4), (2, 4), (0, 0), (1, -6), (3, 0)}
Functions • A function is a relation in which the members of the domain (x-values) DO NOT repeat. • So, for every x-value there is only one y-value that corresponds to it. • y-values can be repeated.
Functions • Discrete functions consist of points that are not connected. • Continuous functions can be graphed with a line or smooth curve and contain an infinite number of points.
Do the ordered pairs represent a function? {(3, 4), (7, 2), (0, -1), (-2, 2), (-5, 0), (3, 3)} No, 3 is repeated in the domain. {(4, 1), (5, 2), (8, 2), (9, 8)} Yes, no x-coordinate is repeated.
Graphs of a Function Vertical Line Test: If a vertical line is passed over the graph and it intersects the graph in exactly one point, the graph represents a function.
Yes D: all reals R: all reals Yes D: all reals R: y ≥ -6 x x y y Does the graph represent a function? Name the domain and range.
No D: x ≥ 1/2 R: all reals No D: all reals R: all reals x x y y Does the graph represent a function? Name the domain and range.
Yes D: all reals R: y ≥ -6 No D: x = 2 R: all reals x x y y Does the graph represent a function? Name the domain and range.
Function Notation • When we know that a relation is a function, the “y” in the equation can be replaced with f(x). • f(x) is simply a notation to designate a function. It is pronounced ‘f’ of ‘x’. • The ‘f’ names the function, the ‘x’ tells the variable that is being used.
Value of a Function Since the equation y = x - 2 represents a function, we can also write it as f(x) = x - 2. Find f(4): f(4) = 4 - 2 f(4) = 2
Value of a Function If g(s) = 2s + 3, find g(-2). g(-2) = 2(-2) + 3 =-4 + 3 = -1 g(-2) = -1
Value of a Function If h(x) = x2 - x + 7, find h(2c). h(2c) = (2c)2 – (2c) + 7 = 4c2 - 2c + 7
Value of a Function If f(k) = k2 - 3, find f(a - 1) f(a - 1)=(a - 1)2 - 3 (Remember FOIL?!) =(a-1)(a-1) - 3 = a2 - a - a + 1 - 3 = a2 - 2a - 2
Special Functions Algebra 2HN
Objectives • Identify and graph special functions • Direct variation • Constant • Identity • Absolute Value • Greatest Integer
During a thunderstorm, Kelly recorded how long it was between seeing the lightning and hearing the thunder. The distance d in kilometers between Kelly and the lightning can be estimated by d=1/3 s, where s is the number of seconds between seeing the lightning and hearing the thunder. Application
Direct Variation • From the equation written in slope-intercept form, you find that the slope is 1/3 and the y-intercept is 0. Whenever a linear function in the form of y = mx + b has b = 0 and m ≠ 0, the function is called a direct variation.
In this situation, the distance varies directly as the number of seconds. In other words, if you hear the thunder soon after you see the lightning, you are fairly close to the lightning. On the other hand, if you don’t hear the thunder for a long time after you see the lightning, then the lightning is far away. Direct Variation Direct variation goes through the origin. A relationship that can be described by an equation in the form y = kx where k ≠ 0 Ex: y = -2x or example above
Indirect variation Indirect/Inverse variation Symbolically, y varies indirectly with x when xy = k or y = k/x. Graphically an indirect variation is a curve, not a straight line as in the direct variation. Refer to Figure 2. We know that because y varies inversely with x. You don’t need this for this assignment, but it’s nice to know. (NTN)
Constant Function • m = 0 • Horizontal line • f(x) = b
Identity Function • m = 1; b = 0 • f(x) = x
Absolute Value Function • f(x) = |x| or y = |x| • Special shape • You see that when x is positive or negative, the absolute value looks like a graph of y = x. When x is negative, the absolute value function looks like the graph of y = -x
Ex. 1: Graph f(x) = |x| + 3 and g(x) = |x + 3| on the same coordinate plane. Determine the similarities and differences in the two graphs. • Find several ordered pairs that satisfy each function. Then graph the points.
Ex. 1: Graph f(x) = |x| + 3 and g(x) = |x + 3| on the same coordinate plane. Determine the similarities and differences in the two graphs. • Find several ordered pairs that satisfy each function. Then graph the points.
Ex. 1: Graph f(x) = |x| + 3 and g(x) = |x + 3| on the same coordinate plane. Determine the similarities and differences in the two graphs. • Graph the points and connect them. Both graphs have the same shape and form congruent angles, but have their vertices at different points.
Step Functions • Step function are also related to linear functions. The open circle means that the point is not included in that part of the graph.
Greatest Integer Function • One type of step function is the greatest integer function. The symbol [x] means the greatest integer not greater than x. For example, [6.2] is 6 and [-1.8] is -2, because -1 > -1.8. The greatest integer function is given by f(x) = [x]. Its graph looks like this.
Example 2: The Speedy-Fast Parcel Service charges for delivering packages by the weight of the package. If the package weighs less than 1 pound, the cost of delivery is $2. If the package weighs at least 1 pound, but less than 2 pounds, the cost is $3.50. For each additional pound, the cost of delivery increases $1.50. Graph the function that describes this relationship. • This is an example of an application of the greatest integer function. The equation that describes this function is f(x) = 1.50[x] + 2