Download
1 / 13
170 likes | 650 Views
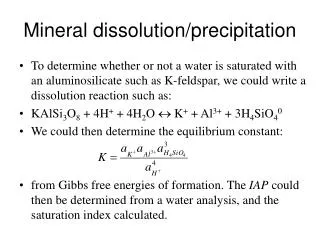
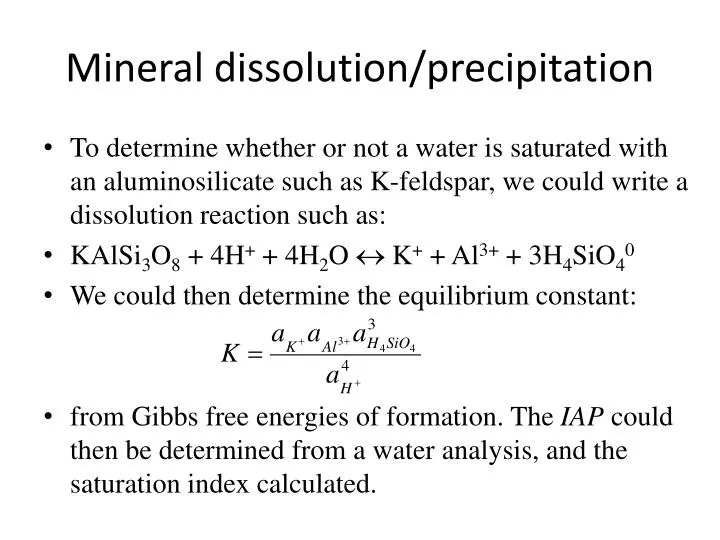
Mineral dissolution/precipitation. To determine whether or not a water is saturated with an aluminosilicate such as K-feldspar, we could write a dissolution reaction such as: KAlSi 3 O 8 + 4H + + 4H 2 O K + + Al 3+ + 3H 4 SiO 4 0 We could then determine the equilibrium constant:

E N D
Mineral dissolution/precipitation • To determine whether or not a water is saturated with an aluminosilicate such as K-feldspar, we could write a dissolution reaction such as: • KAlSi3O8 + 4H+ + 4H2O K+ + Al3+ + 3H4SiO40 • We could then determine the equilibrium constant: • from Gibbs free energies of formation. The IAP could then be determined from a water analysis, and the saturation index calculated.
INCONGRUENT DISSOLUTION • Aluminosilicate minerals usually dissolve incongruently, e.g., 2KAlSi3O8 + 2H+ + 9H2O Al2Si2O5(OH)4 + 2K+ + 4H4SiO40 • As a result of these factors, relations among solutions and aluminosilicate minerals are often depicted graphically on a type of mineral stability diagram called an activity diagram.
ACTIVITY DIAGRAMS: THE K2O-Al2O3-SiO2-H2O SYSTEM We will now calculate an activity diagram for the following phases: gibbsite {Al(OH)3}, kaolinite {Al2Si2O5(OH)4}, pyrophyllite {Al2Si4O10(OH)2}, muscovite {KAl3Si3O10(OH)2}, and K-feldspar {KAlSi3O8}. The axes will be aK+/aH+ vs. aH4SiO40. The diagram is divided up into fields where only one of the above phases is stable, separated by straight line boundaries.
Activity diagram showing the stability relationships among some minerals in the system K2O-Al2O3-SiO2-H2O at 25°C. The dashed lines represent saturation with respect to quartz and amorphous silica.
P cycling and sediment microbes N cycling and sediment microbes Ammonifying bacteria NH4+ NO3- Linking nutrient cycling and redox chemistry in fresh water lakes PO43- PO43- PO43- Iron reducers PO43- FeOOH Fe2+ PO43- PO43- H2S PO43- FeS2 Sulfate Reducers Blue Green Algae blooms?
Solid State Analysis • X-Ray Fluorescence Spectroscopy (XRF) • X-ray Diffraction (XRD)
Extractions • Using selected acids, bases, organics, chelators to dissolve a subset of minerals • Many possibilities for this • We will look at 2 used to investigate Fe, Mn, P: • Aqua Regia – Combination of Nitric Acid and Hydrochloric acid, heated to just below boiling – dissolved most stuff (but not all!!) • Ascorbic Acid extraction – Combination of ascorbic acid and bicarbonate
FeOOH/MnOOH in sediments • Ascorbic acid extraction technique specific to ‘reactive’ Fe and Mn (Kostka and Luther, 1994) • XRD data confirms reactive stuff is ferrihydrite • Size is nanloparticulate, sensitive to degree of recycling!
Where is the Phosphorus? P mobility measured through hundreds of sediment digests for samples in Missisquoi Bay collected at different times, places, and depths Only strong and consistent correlation is with reactive Fe, present predominantly as nanoparticulate FeOOH particles