Download
1 / 7
90 likes | 351 Views
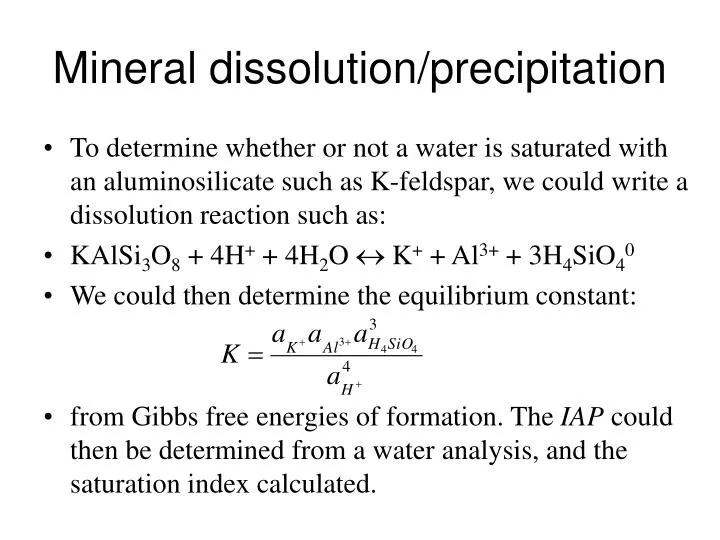
Mineral dissolution/precipitation. To determine whether or not a water is saturated with an aluminosilicate such as K-feldspar, we could write a dissolution reaction such as: KAlSi 3 O 8 + 4H + + 4H 2 O K + + Al 3+ + 3H 4 SiO 4 0 We could then determine the equilibrium constant:

E N D
Mineral dissolution/precipitation • To determine whether or not a water is saturated with an aluminosilicate such as K-feldspar, we could write a dissolution reaction such as: • KAlSi3O8 + 4H+ + 4H2O K+ + Al3+ + 3H4SiO40 • We could then determine the equilibrium constant: • from Gibbs free energies of formation. The IAP could then be determined from a water analysis, and the saturation index calculated.
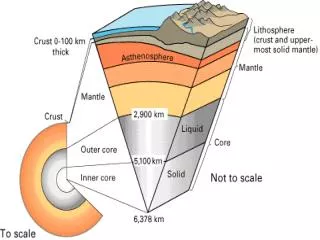
INCONGRUENT DISSOLUTION • Aluminosilicate minerals usually dissolve incongruently, e.g., 2KAlSi3O8 + 2H+ + 9H2O Al2Si2O5(OH)4 + 2K+ + 4H4SiO40 • As a result of these factors, relations among solutions and aluminosilicate minerals are often depicted graphically on a type of mineral stability diagram called an activity diagram.
ACTIVITY DIAGRAMS: THE K2O-Al2O3-SiO2-H2O SYSTEM We will now calculate an activity diagram for the following phases: gibbsite {Al(OH)3}, kaolinite {Al2Si2O5(OH)4}, pyrophyllite {Al2Si4O10(OH)2}, muscovite {KAl3Si3O10(OH)2}, and K-feldspar {KAlSi3O8}. The axes will be aK+/aH+ vs. aH4SiO40. The diagram is divided up into fields where only one of the above phases is stable, separated by straight line boundaries.
Activity diagram showing the stability relationships among some minerals in the system K2O-Al2O3-SiO2-H2O at 25°C. The dashed lines represent saturation with respect to quartz and amorphous silica.
Lines • Fe(OH)3(ppd) + H+ = H2O + Fe(OH)2+ • Log K = -0.7799 (From DGR) • K1 = [H2O][Fe(OH)2+] / [Fe(OH)3(ppd)][H+] • K1 = [Fe(OH)2+] / [H+] • But need to plot Fe3+ vs. H+… • Fe3+ + 2 H2O = Fe(OH)2+ + 2 H+ • K2 = [Fe(OH)2+][H+]2 / [Fe3+] = log K2=-5.6689 • [Fe(OH)2+] = K2 [Fe3+] / [H+]2 substitute • K1 = K2 [Fe3+] / [H+]3 [Fe3+] = K1[H+]3 / K2 • log[Fe3+] = 3log[H+] + (logK1 - logK2)