Download
1 / 38
380 likes | 539 Views
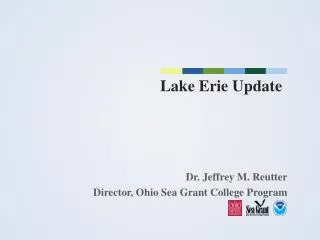
L ake Erie Update--2013. Dr. Jeffrey M. Reutter Director, Ohio Sea Grant College Program. Blue-green Algae Bloom circa 1971, Lake Erie. Photo: Forsythe and Reutter. June 22, 1969. Lake Erie wasn’t always the Walleye Capital of the World.

E N D
Lake Erie Update--2013 Dr. Jeffrey M. Reutter Director, Ohio Sea Grant College Program
Blue-green Algae Bloom circa 1971, Lake Erie Photo: Forsythe and Reutter
June 22, 1969 Lake Erie wasn’t always the Walleye Capital of the World
What brought about the rebirth (dead lake to Walleye Capital)? Phosphorus reductions from point sources (29,000 metric tons to 11,000).
2012 Spring TP load, Maumee R. TP loading during March-June 2012 was one of the lowest on record, resulting in a much smaller algal bloom. Source: Tom Bridgeman, UT
Microcystis, Stone Lab, 8/10/10 Photos: Jeff Reutter
October 9, 2011 Photo: NOAA Satellite Image
Microcystis near Marblehead October 9, 2011 Photo: Richard Kraus, United States Geological Survey
2013 Microcystis open waterbloom 2013 open water bloom was second only to 2011 over last 12 years. Source: Tom Bridgeman, UT.
2013 Forecast: Significant bloom.similar to 2003, much milder than 2011 2013
Reference Dose = amount that can be ingested orally by a person, above which a toxic effect may occur, on a milligram per kilogram body weight per day basis. Toxicity of Algal Toxins Relative to Other Toxic Compounds found in Water Toxin Reference Doses Dioxin (0.000001 mg/kg-d) Microcystin LR (0.000003 mg/kg-d) Saxitoxin(0.000005 mg/kg-d) PCBs (0.00002 mg/kg-d) Cylindrospermopsin (0.00003 mg/kg-d) Methylmercury(0.0001 mg/kg-d) Anatoxin-A (0.0005 mg/kg-d) DDT (0.0005 mg/kg-d) Selenium (0.005 mg/kg-d) Botulinum toxin A (0.001 mg/kg-d) Alachlor (0.01 mg/kg-d) Cyanide (0.02 mg/kg-d) Atrazine (0.04 mg/kg-d) Fluoride (0.06 mg/kg-d) Chlorine (0.1 mg/kg-d) Aluminum (1 mg/kg-d) Ethylene Glycol (2 mg/kg-d)
Are HABs only a Lake Erie and Ohio Problem? Serious problem in US and Canada 21 states and Canada in 2012 Global problem Chaired Loadings and Targets Subcommittee for Ohio P Task Force Now US Co-Chair of the Loadings and Targets Task Team of Annex 4 (nutrients) Subcommittee of GLWQA Weather can determine how we experience a bloom
11 years of satellite data provide bloom extent high medium low Data from MERIS 2002-2011, MODIS 2012
2013 prediction for western Lake Erie:similar to 2003, <1/5 of 2011, 2X 2012 2011 for comparison 2013 may resemble 2003 low medium high concentration
October 12, 2013 R. Stumpf, NOAA National Center for Coastal Ocean Science
2013 • Only blooms in 2011 and 2013 extended well into October. • Toxins appeared in treated drinking water in 2013. • Meris vs. Modis Limitations • Greater recognition of of their role by agriculture community, but clearly not enough action. • When nutrients leave fields they are pollutants. • Goal should be no nutrients leaving fields
1972 Great Lakes Water Quality Agreement • Signed by President Nixon & Prime Minister Trudeau • Purpose: • Control Pollution • Research Problems • Measure Cleanup Progress • Standing Reference (Task) for IJC • Established Great Lakes Regional Office in Windsor & advisory boards • Results: Ban of phosphorus in detergents, increased treatment levels, point source controls & dramatic improvements
New Agreement Signed in 2012 • June 2009 The U.S and Canada agree to renegotiate the Great Lakes Water Quality Agreement
Great Lakes Water Qual Agreement--2012 • 10 Annexes • Each annex has several Task Teams • Gail and I serve on Annex 4—Nutrients • I am US Co-chair the Objectives and Loadings Task Team • Nutrient problems are different in each basin of Lake Erie and in each Great Lake • I also serve on Annex 2—LaMPs
For more information:Dr. Jeff Reutter, Director Ohio Sea Grant and Stone Lab Ohio State Univ. 1314 Kinnear Rd. Col, OH 43212 614-292-8949 Reutter.1@osu.edu ohioseagrant.osu.edu Stone Laboratory Ohio State Univ. Box 119 Put-in-Bay, OH 43456 614-247-6500
Southernmost Image: Ohio Sea Grant
80:10:10 Rule • 80% of water from upper lakes • 10% direct precipitation • 10% from Lake Erie tributaries • Maumee • Largest tributary to Great Lakes • Drains 4.5 million acres of ag land • 3% of flow into Lake Erie
Therefore, The 80% we get from the upper lakes and the 10% that represents precipitation is likely much cleaner than the 10% that comes in from the small tributaries around Lake Erie. Why—those lakes have lots of forest cover and very little agriculture.
Because of Land Use, Lake Erie Gets: More sediment More nutrients (fertilizers and sewage) More pesticides (The above 3 items are exacerbated by storms, which will be more frequent and severe due to climate change.) And Lake Erie is still biologically the most productive of the Great Lakes—And always will be!!
50:2 Rule (Not exact, but instructive) Lake Superior: 50% of the water and 2% of the fish Lake Erie: 2% of the water and 50% of the fish
Lake Erie’s 7 Biggest Problems/Issues (see Twine Line, Spring/Summer, 2012) • Sedimentation • Phosphorus and nutrient loading • Harmful algal blooms • Western, Central, and Eastern Basin Differences • Different problems in different lakes (possibly more difficult than Lake Erie) • Aquatic invasive species • Dead Zone—exacerbated by nutrients • Climate Change—Makes the others worse • Coastal Economic Development
Events Leading to the Great Lakes Water Quality Agreement • 1940-1960 Rapid industrial growth - excessive nutrient loading, high algal growth, low oxygen & massive fish kills • 1946 IJC Reports on Pollution of Connecting Channels (1950) • DDT and other pesticides cause deformities; reproductive failure in fish and birds • 1964 IJC Reports on Pollution in Lake Erie & Lower Lakes (1970) • Lake Erie declared dead & Cuyahoga River Fire (1969) • Intense public outcry over the environment
Organization • 3 international agreements between U.S. and Canada serve as platform for managing most water resources
Oversight & Implementation • The IJC and the Governments share common goals of the agreement, but have different responsibilities. • The IJC monitors progress and reports to the governments. • The Governments are responsible for implementing the agreement. • IJC reports are released to both the governments and the public; the IJC depends upon public opinion to compel government action.
Background—CSMI • Cooperative Monitoring Initiative (CMI) started in 2002 to coordinate monitoring • Expanded mandate of CMI to include research coordination resulted in CSMI in 2006 • In 2009, connecting channels (including St. Lawrence) were added to CSMI process • CSMI follows a 5 year rotational cycle • CSMI does NOT set priorities
Lake Huron Lake Ontario CSMI Cycle Lake Superior Lake Erie Lake Michigan* Rotational CSMI Cycle * Canada will participate in another lake
Ohio Sea Grant Projects 2014-16 R/MD-002 Beneficial reuse of dredged material in manufactured soil blending: Economic/logistical and performance considerations PI: Elizabeth Dayton, Ohio State University R/ES-012 Impacts of climate change on public health in the Great Lakes due to harmful algae blooms PI: Jay Martin, Ohio State University R/ER-097 Should nitrogen be managed in Lake Erie? The potential role of nitrogen fixation by cyanobacteria PI: Darren Bade, Kent State University R/ER-104 Source tracking and toxigenicity of Planktothrix in Sandusky Bay PI: George S. Bullerjahn, Bowling Green State University R/PS-049 Mapping drain tile and modeling agricultural contribution to nonpoint source pollution in the western Lake Erie basin PI: Kevin Czajkowski, University of Toledo R/ER-103 The role of nitrogen concentration in regulating cyanobacterial bloom toxicity in a eutrophic lake PI: Justin Chaffin, Ohio State University