Download
1 / 39
390 likes | 480 Views
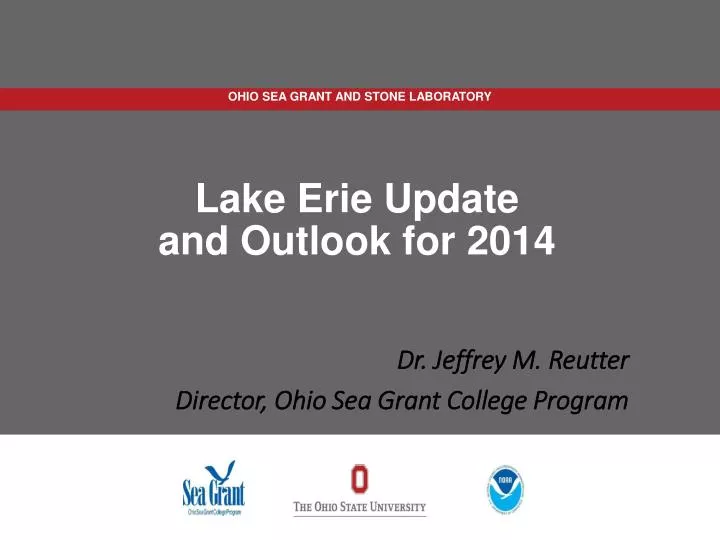
L ake Erie Update and Outlook for 2014 . Dr. Jeffrey M. Reutter Director, Ohio Sea Grant College Program. Jeffrey M. Reutter, Ph.D., Director. 1895—F.T. Stone Laboratory 1970—Center for Lake Erie Area Research (CLEAR) 1978—Ohio Sea Grant College Program

E N D
Lake Erie Updateand Outlook for 2014 Dr. Jeffrey M. Reutter Director, Ohio Sea Grant College Program
Jeffrey M. Reutter, Ph.D., Director 1895—F.T. Stone Laboratory 1970—Center for Lake Erie Area Research (CLEAR) 1978—Ohio Sea Grant College Program 1992—Great Lakes Aquatic Ecosystem Research Consortium (GLAERC) Grad student at Stone Lab in 1971 and never left. Director since 1987.
Southernmost Image: Ohio Sea Grant
80:10:10 Rule • 80% of water from upper lakes • 10% direct precipitation • 10% from Lake Erie tributaries • Maumee • Largest tributary to Great Lakes • Drains 4.5 million acres of ag land • 3% of flow into Lake Erie
Discuss 3 Basins & Retention Time Photo: Ohio Sea Grant
Because of Land Use, Lake Erie Gets: More sediment More nutrients (fertilizers and sewage) More pesticides (The above 3 items are exacerbated by storms, which will be more frequent and severe due to climate change.) And Lake Erie is still biologically the most productive of the Great Lakes—And always will be!!!
50:2 Rule(Not exact, but instructive) Lake Superior: 50% of the water and 2% of the fish Lake Erie: 2% of the water and 50% of the fish
Lake Erie Stats Drinking water for 11 million people Over 20 power plants Power production is greatest water use 300 marinas in Ohio alone Walleye Capital of the World 40% of all Great Lakes charter boats Ohio’s charter boat industry is one of the largest in North America $1.5 billion sport fishery One of top 10 sport fishing locations in the world Most valuable freshwater commercial fishery in the world Coastal county tourism value is over $11.5 billion and 119,000 jobs
Lake Erie: One of the Most Important Lakes in the World Dead lake image of 60s and 70s. Poster child for pollution problems in this country. But, most heavily utilized of any of the Great Lakes. Shared by 5 states, a province, and 2 countries. Best example of ecosystem recovery in world.
June 22, 1969 Lake Erie wasn’t always the Walleye Capital of the World
Blue-green Algae Bloom circa 1971, Lake Erie Photo: Forsythe and Reutter
What brought about the rebirth (dead lake to Walleye Capital)? Phosphorus reductions from point sources (29,000 metric tons to 11,000).
Impact of Ecosystem Recovery (rebirth) Ohio walleye harvest 112,000 in 1976 to over 5 million by mid-80s 34 charter fishing businesses in 1975 to over 1200 by mid-80s and almost 800 today 207 coastal businesses to over 425 today
Algae are tiny plant-like organisms that live in water There are hundreds of species of algae in Lake Erie. Most are beneficial. Source: Tom Bridgeman, UT
Major groups/kinds in Lake Erie Diatoms Greens Blue-greens (Cyanobacteria) Source: Tom Bridgeman, UT
Impacts of Increased Phosphorus Concentrations • HABs—If P concentrations are high (regardless of the source, Ag, sewage, etc.) and water is warm, we will have a HAB (nitrogen concentration will likely determine which of the 7-10 species bloom) • Nuisance Algae Blooms • Cladophora—Whole lake problem. An attached form. • Winter algal blooms • Dead Zone in Central Basin
11 years of satellite data provide bloom extent high medium low Data from MERIS 2002-2011, MODIS 2012
Reference Dose = amount that can be ingested orally by a person, above which a toxic effect may occur, on a milligram per kilogram body weight per day basis. Toxicity of Algal Toxins Relative to Other Toxic Compounds found in Water Toxin Reference Doses Dioxin (0.000001 mg/kg-d) Microcystin LR (0.000003 mg/kg-d) Saxitoxin(0.000005 mg/kg-d) PCBs (0.00002 mg/kg-d) Cylindrospermopsin (0.00003 mg/kg-d) Methylmercury(0.0001 mg/kg-d) Anatoxin-A (0.0005 mg/kg-d) DDT (0.0005 mg/kg-d) Selenium (0.005 mg/kg-d) Botulinum toxin A (0.001 mg/kg-d) Alachlor (0.01 mg/kg-d) Cyanide (0.02 mg/kg-d) Atrazine (0.04 mg/kg-d) Fluoride (0.06 mg/kg-d) Chlorine (0.1 mg/kg-d) Aluminum (1 mg/kg-d) Ethylene Glycol (2 mg/kg-d)
Are HABs only a Lake Erie and Ohio Problem? Serious problem in US and Canada 21 states and Canada in 2012 Global problem Chaired Loadings and Concentrations Subcommittee for Ohio P Task Force Now US Co-Chair of the Objectives and Loadings Task Team of Annex 4 (nutrients) Subcommittee of GLWQA Weather can determine how we experience a bloom
Blue-green Algae Bloom circa 1971, Lake Erie Photo: Forsythe and Reutter
Microcystis, Stone Lab, 8/10/10 Photos: Jeff Reutter
October 9, 2011 Photo: NOAA Satellite Image
Microcystis near Marblehead Photo: Richard Kraus, United States Geological Survey October 9, 2011
2012 TP loading during March-June 2012 was one of the lowest on record, resulting in a much smaller algal bloom. Spring TP load, Maumee R. Source: Tom Bridgeman, UT
2013 Forecast: Significant bloom.similar to 2003, much milder than 2011 2013
2013 Microcystis open waterbloom 2013 open water bloom was second only to 2011 over last 12 years. Source: Tom Bridgeman, UT.
2013 prediction for western Lake Erie:similar to 2003, <1/5 of 2011, 2X 2012 2013 may resemble 2003 2011 for comparison low medium high Concentration
October 12, 2013 R. Stumpf, NOAA National Center for Coastal Ocean Science
2013 • Only blooms in 2011 and 2013 extended well into October. • Toxins appeared in treated drinking water in 2013. • Carroll Treatment Plant shut down—bottle water brought in • Toledo and Erie Co. say can’t guarantee safe drinking water in future • No national or state guidelines on algal toxins • Meris vs. Modis Satellite Limitations • Greater recognition of of their role by agriculture community, but clearly not enough action. • When nutrients leave fields they are pollutants.
Target Loads to Solve Problem Leading subcommittee of the Ohio Phosphorus Task Force to identify both spring and annual target loads of both total P and DRP (Reutter comment) to prevent or greatly reduce HABs Target is 40% reduction
Nutrient Loading: Expect improvement • Scotts P removal from over the counter fertilizer bags • CSO’s moving in right direction (too slow?) • Detroit sewage—hopefully in compliance—but bankrupt • Frequency of severe storms continues to go up • Ag—expect improvement • Farm Bureau is supporting efforts to reduce P • Majority of farmers now accept responsibility • Certification programs being developed • 4R Program • Recommendations • Don’t apply more fertilizer than needed • Don’t apply on frozen or snow covered ground • Don’t broadcast apply, incorporate into soil • Don’t apply when rain in immediate forecast
Different Water Bodies/Different Problems • Retention time for nutrients • Flow rate • Current • Depth • Western Basin = HABs • Quick fix • Central Basin = dead zone (hypoxia) • Long time to cure (maybe never) • Eastern Basin = nuisance algae • Unsure of time to cure because unsure of nutrient source
For more information:Dr. Jeff Reutter, Director Ohio Sea Grant and Stone Lab Ohio State Univ. 1314 Kinnear Rd. Col, OH 43212 614-292-8949 Reutter.1@osu.edu ohioseagrant.osu.edu Stone Laboratory Ohio State Univ. Box 119 Put-in-Bay, OH 43456 614-247-6500