Download

1 / 20
200 likes | 318 Views
EDI Neighbourhood Data. 2006- 2011 EDI Results & 2011 Neighbourhood Demographics. EDI. The Early Development Instrument (EDI) gathers data about children’s developmental vulnerability.

E N D
EDI Neighbourhood Data 2006- 2011 EDI Results & 2011 Neighbourhood Demographics
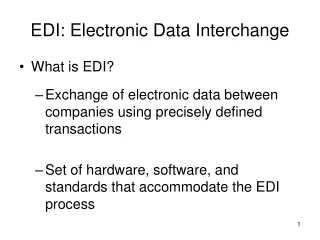
EDI • The Early Development Instrument (EDI) gathers data about children’s developmental vulnerability. • EDI is a population-based tool that measures children’s development in five key domains, providing a snapshot of how developmentally ready children are when they enter Grade 1. • Examining results by these domains helps to determine strengths and needs of a particular population (community) so that our communities have a better understanding of the relationship between the way children develop and the environment in which they live.
EDI – What We Know • Research by staff at the Offord Centre has found: • Birth circumstances have an important impact on children’s readiness to learn at school • Children with low birth weight and/or preterm births were more likely to score in the lowest 10th percentile (vulnerable) • Children with normal birth weight and full-term pregnancies were least likely to score low in two or more readiness to learn domains
EDI – What We Know • Lower neighbourhood school readiness has been associated with: • Lower income • Higher % of lone-parent families • Higher % of low income families • Higher % of families who have moved within the last year Research conducted by M. Janus and D. Offord – Offord Centre for Child Studies
National Household Survey Data • Provides data that was previously collected in Census • Suppresses data for areas where the response was less than 50% of the population • Data definitions changed from Census to NHS making it difficult to compare historically (some, but not all) • Population Counts still with Census