Download
1 / 44
450 likes | 604 Views
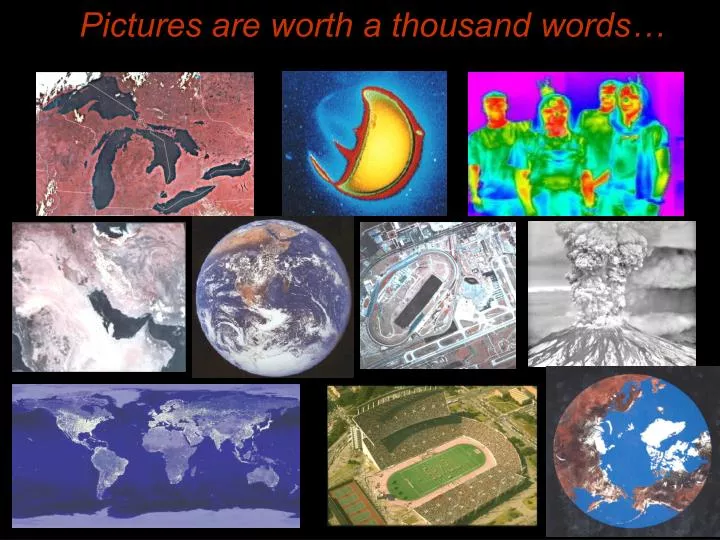
Pictures are worth a thousand words…. Introduction to Remote Sensing. Spatial, spectral, temporal resolutions Image display alternatives Vegetation Indices Image classifications Image change detections Accuracy assessment Satellites & Air-Photos. Selected RS Systems.

E N D
Introduction to Remote Sensing • Spatial, spectral, temporal resolutions • Image display alternatives • Vegetation Indices • Image classifications • Image change detections • Accuracy assessment • Satellites & Air-Photos
Selected RS Systems • Landsat TM & Enhanced TM (Thematic Mapper) • Ikonos & Quickbird • MODIS (Moderate Resolution Imaging Spectrometer) • Radarsat & ERS (European RS Satellite) • SeaWiFS (Sea-Viewing Wide Field-of-View Sensor) • GOES (Geostationary Operational Environ. Satellite) • AVHRR (Advanced Very High Resolution Radiometer) • SPOT (High Resolution Visible) • Others
Digital Satellite Data • Remote sensing: the acquisition of data about an object or area by a sensor that is physically far from the object or area. • Digital satellite data is one type of remotely-sensed data • aerial photography is another type of remotely-sensed geographic information • Important advantage of remote sensing data: • synoptic perspective: comprehensive view of large areas of the Earth’s surface, vantage point of observation, digital format, multi-spectral, multi-temporal, multi-spatial.
Satellite Data - Benefits & Problems • Benefits: • it is already digital (unlike standard aerial photos) -- readily lends itself to manipulation and analysis to extract useful information • synoptic perspective • repeat coverage of areas • minimal scale and geometric distortion problems relative to aerial photos • Problems: • generally low spatial resolution compared to aerial photos • large data storage volumes • distortions in data values due variations in atmospheric conditions, clouds, terrain, solar angle, etc... -- require preprocessing to correct!
Increasing Wavelength Increasing Frequency and Energy Electromagnetic Spectrum (EMS) Visible Portion At a given Temperature, T 0.4 0.5 0.6 0.7 Cosmic Gamma X-rays UV Infrared Microwave Radio/TV Rays Rays Near/Medium/Thermal 10-6 10-4 10-2 1 102 104 106 108 Wavelength in Micrometers (= 103 nanometers)
Passive (Optical) Sensor Technology Incoming EMR Reflected EMR Emitted EMR
Electromagnetic Radiation Spectrum • Remote sensing satellites record data on electromagnetic radiation (EMR) • satellites have detectors that record specific wavelengths in the EM spectrum • EM radiation interacts with physical matter • some wavelengths are absorbed & others reflected • determine/estimate matter type by analyzing spectral “signatures” in satellite data
“The Four RS Resolutions” • Satellite data characterized by four resolutions: • spatial resolution: area on ground represented by each pixel (cell) in the satellite data. • temporal resolution: how frequently a satellite platform obtains imagery of a particular area , orbital characteristics. • spectral resolution: specific EM spectrum wavelength intervals captured/recorded by a particular satellite sensor. • radiometric resolution: number of possible data values recorded/reportable by each satellite sensor, precision with which the EM spectral values are reported.
Aerial Photographs • Scale = Focal Length/Flying Height • Principal Point & Conjugate PP • Radial Displacement • Parallax • Forward-Lap & Side-Lap • Stereoscopic Analysis & Stereoscopes • See photos for examples
high BV medium BV low BV Satellite Data - Pixel Brightness Values • “Brightness Value” (BV) corresponding to intensity of EM radiation in specified spectral range detected for that pixel • lower BV = lower level of EM radiation detected • higher BV = higher level of EM radiation detected • Displaying/viewing satellite data: • For displaying/viewing satellite images: • high BVs assigned bright/light color value • low BVs assigned dark/dim color value
on-screen display: Band 4 - near infrared Band 3 - red visible Band 2 - green visible + + = Band 2 - green visible Band 7 - middle infrared Band 4 - near infrared on-screen display: + + = Satellite Data - Pixel Brightness Values & Display • Landsat TM Multi-Spectral Display : RED GUN GREEN GUN BLUE GUN
RGB Compositing Process PAINT PAINT PAINT Infrared band (4) Red band (3) Green band (2) Red color gun Green color gun Blue color gun
Panchromatic Display Panchromatic display of a single band
Multispectral Composite Display Visible red (red gun), green (green gun), blue (blue gun) – “true”color
Multispectral Composite Display Near infrared (red gun), red (green gun), green (blue gun): “false color”
Multispectral Composite Display Middle infrared (red gun), near infrared (green gun), green (blue gun): “false color”
Different Spatial Resolutions 1-2 m 30 m 79 m 1.1 km QuickBird, Landsat TM, Landsat MSS AVHRR IKONOS ETM
Daytona 500 RacetrackFebruary 1995, NAPP (USGS EDC) racetrack grandstands Lake Lloyd
Smoke Plumes from Oil Fires Kuwait Oil Fires, April 1991Space Shuttle
SeaWiFS of Europe & UK: particulate pollution in southern UK and dust cloud in southern Spain
Landsat 7 Enhanced Thematic Mapper (ETM+) • Washington, DC • Bands 4, 3, 2 • (infrared, red, green)
Digital Image Data MSS 1973 TM 1999 IKONOS 1999