Download
1 / 23

E N D
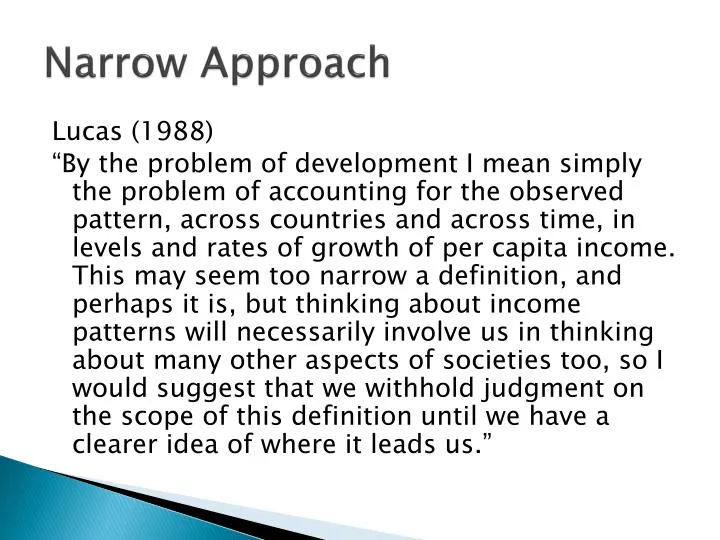
Narrow Approach Lucas (1988) “By the problem of development I mean simply the problem of accounting for the observed pattern, across countries and across time, in levels and rates of growth of per capita income. This may seem too narrow a definition, and perhaps it is, but thinking about income patterns will necessarily involve us in thinking about many other aspects of societies too, so I would suggest that we withhold judgment on the scope of this definition until we have a clearer idea of where it leads us.”
Broad Streeten (1994) “[W]e should never lose sight of the ultimate purpose of the exercise, to treat men and women as ends, to improve the human condition, to enlarge people’s choices…[A] unity of interests would exist if there were rigid links between economic production (as measured by income per head) and human development (reflected by human indicators such as life expectancy or literacy, or achievements such as self-respect, not easily measured). But these two sets of indicators are not very closely related.”
Measuring Progress toward Development • per-capita Gross National Product the per-head value of final goods and services produced by the people of a country over a given year • per capita Gross Domestic Product the per-head value of final goods and services produced within a nation’s boarders over a given year
Measuring Progress toward Development • The Exchange Rate Method: Each country’s currency is converted into a common currency (usually US$) and divided by the country’s population. • In World Bank Data: Data are converted from national currency to current U.S. $ using the World Bank Atlas method. • This involves using a 3-year average of exchange rates to smooth the effects of transitory exchange rate fluctuations. • Problems: • Underreported income or non-measurable income in LDCs • Prices for many goods in all countries are not appropriately reflected in exchange rates
Measuring Progress toward Development • Purchasing Power Parity (PPP): idea that similar foreign and domestic goods or (basket of goods) should have the same price in terms of the same currency. • How much money is needed to purchase the same basket of goods in 2 countries? • It is the Purchasing Power of a country’s currency required to purchase the same basket of goods/services that a US$ will buy in the US. • International prices are constructed for large baskets of goods & services (400-700 goods) by averaging prices (expressed, say in US$ - Phome/PUS) for each good over all countries. • then averaged across categories to get 150 relative prices.
Measuring Progress toward Development • Purchasing Power Parity (PPP) • National Income is then estimated by valuing its output at these international PPP prices. • Recall, since the price of non-traded goods are lower in LDCs (since wages are lower), the PPP measurements of national income are higher than the exchange rate method.
World Development Indicators, Online Differences in Exchange Rate Method and PPP Method
What stories do socioeconomic indicators tell? • Start with Income Distribution
Development, another look Source: World Development Indicators Source: UN Human Development Report, 2011
Development, another look • Human Development Index (HDI) • Developed by the United Nations Development Program (UNDP) • HDI ranks all countries on a scale of 0 (lowest human development) to 1 (highest development) • (1/3) longevity: life expectancy at birth • (1/3) knowledge: expected years of schooling and mean years of schooling • (1/3) standard of living: real per capita income adjusted for the differing PPP of each country’s currency
Development, another look Source: World Development Indicators Source: UN Human Development Report, 2011
HDI Trends over Time Romania South Africa Source: UN Human Development Report, 2011
Structural Characteristics Source: World Development Indicators
Structural Characteristics Source: World Development Indicators
Structural Characteristics Source: World Development Indicators