Download

1 / 39
420 likes | 618 Views
Summer Course: Introduction to Epidemiology. August 29, 1330-1500. SCREENING. Dr. N. Birkett, Department of Epidemiology & Community Medicine, University of Ottawa. Session Overview. Review key features of tests for detecting disease. Screening programmes Overview Criteria for utility.

E N D
Summer Course:Introduction to Epidemiology August 29, 1330-1500 SCREENING Dr. N. Birkett, Department of Epidemiology & Community Medicine, University of Ottawa
Session Overview • Review key features of tests for detecting disease. • Screening programmes • Overview • Criteria for utility
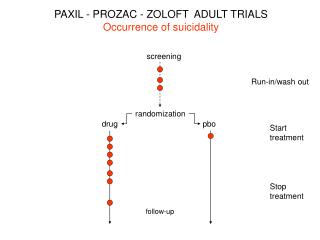
Scenario (1) A 54 year old female teacher visited her family physician for an annual checkup. She reported no illnesses in the previous year, felt well and had no complaints. Hot flashes related to menopause had resolved. A detailed physical examination, including breast palpation, was unremarkable. A screening mammogram was recommended as per current guidelines.
Scenario (2) The mammogram results were ‘not normal’ and a follow-up breast biopsy was recommended. The surgeon confirmed the negative clinical exam. Based on the abnormal mammogram, a fine-needle aspiration biopsy of the abnormal breast under radiological guidance was recommended. Pathological review of the biopsy revealed the presence of a malignant breast tumor. Further surgery was scheduled to pursue this abnormal finding.
Test Properties (1) • Most common situation (for teaching at least) assumes: • Dichotomous outcome (ill/not ill) • Dichotomous test results (positive/negative) • Represented as a 2x2 table (yet another variant!). • Advanced methods can consider tests with multiple outcomes • advanced; • moderate; • minimal; • no disease
Test Properties (2) True Positives False Positives False Negatives True Negatives
Test Properties (3) Sensitivity=0.90 Specificity=0.95
Test Properties (4) Sensitivity Specificity
Test Properties (5) Sensitivity = Pr(test positive in a person with disease) Specificity = Pr(test negative in a person without disease) • Range: 0 to 1 • > 0.9: Excellent • 0.8-0.9: Not bad • 0.7-0.8: So-so • < 0.7: Poor
Test Properties (6) • Generally, high sensitivity associated with low specificity and vice-versa (more later). • Do you want a test with high sensitivity or specificity? • Depends on cost of ‘false positive’ and ‘false negative’ cases. • PKU – one false negative is a disaster. • Ottawa Ankle Rules
Test Properties (7) • Patients don’t ask: • if I’ve got the disease how likely is it that the test will be positive? • They ask: • My test is positive? Does that mean I have the disease? Predictive values.
Test Properties (8) PPV=0.95 NPV=0.90
Test Properties (9) PPV NPV
Test Properties (10) PPV = Pr(subject has disease given that their test was positive) NPV = Pr(subject doesn’t have disease given that their test was negative) • Range: 0 to 1 • > 0.9: Excellent • 0.8-0.9: Not bad • 0.7-0.8: So-so • < 0.7: Poor
Test Properties (11) Effect of disease prevalence • Common diseases are easier to find than rare diseases. • Sensitivity & specificity are not affected by prevalence. • PPV is affected by the prevalence of the disease in the target population. Let’s do an example. Assume we have: • sens = 0.85; spec = 0.9
Test Properties (12) Tertiary care: research study. Prevalence = 0.5 PPV=0.89
Test Properties (13) Primary care: Prevalence = 0.01 PPV=0.08
Test Properties (14) • Most tests give continuous readings • Serum hemoglobin • PSA • X-rays • How to determine ‘cut-point’ for normal vs. diseased (negative vs. positive)? • ↑ sensitivity ↓specificity • Receiver Operating Characteristic (ROC) curves
Negative Positive False -ve False +ve
Negative Positive False +ve False -ve
AUC Area Under Curve
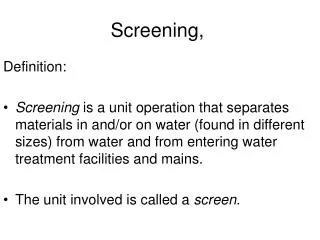
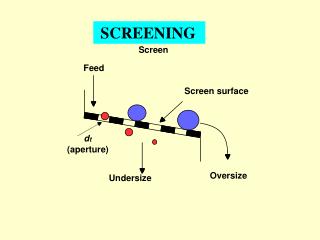
Screening (1) • Screening • The presumptive identification of an unrecognized disease or defect by the application of tests, examinations or other procedures • Can be applied to an unselected population or to a high risk group. • Examples • Pap smears (cervical cancer) • Mammography (breast cancer) • Early childhood development • PKU
Screening (2) • Levels of prevention: • Primary prevention • Secondary prevention • Tertiary prevention • Boundaries between levels are fuzzy • Interventions can impact on multiple outcomes or stages of disease progression • Antihypertensive drugs • secondary prevention for ‘high blood pressure’ • primary prevention for ‘stroke’
Screening (4) DPCP§ § Detectable Pre-Clinical Phase
Screening (6) Criteria to determine if a screening programme should be implemented • Disease Factors • Severity • Presence of a lengthy DPCP • Evidence that earlier treatment improves prognosis
Screening (6) • Test Factors • Valid - sensitive and specific with respect to DPCP • Reliable and reproducible (omitted from most lists, but shouldn’t be) • Acceptable - cf. sigmoidoscopy • Easy • Cheap • Safe
Screening (7) • Test Factors (cont.) • Test must reach high-risk groups - cf Pap smears • Sequential vs. parallel tests • Sequential higher specificity • Parallel higher sensitivity • System Factors • Follow-up provided and available to all • Treatment resources adequate
Screening (8) • Biases in interpreting evaluations of screening programmes. • Lead-time Bias • Detecting disease early gives more years of ‘illness' but doesn’t prolong life • Length Bias • Slowly progressive cases are more likely to be detected than rapidly progressive cases
Screening (12) Screened Detected Slow: 5/5 Fast: 2/5 Better survival than non-screened subjects even if screening is useless
Summary • Diagnostic tests can be evaluated by considering their error rates • sensitivity & specificity are the key parameters used • Screening tests have similar properties • Screening should not be used unless early detection of diseases changes natural history • Screening tests generally need high sensitivity