Download
1 / 32
320 likes | 418 Views
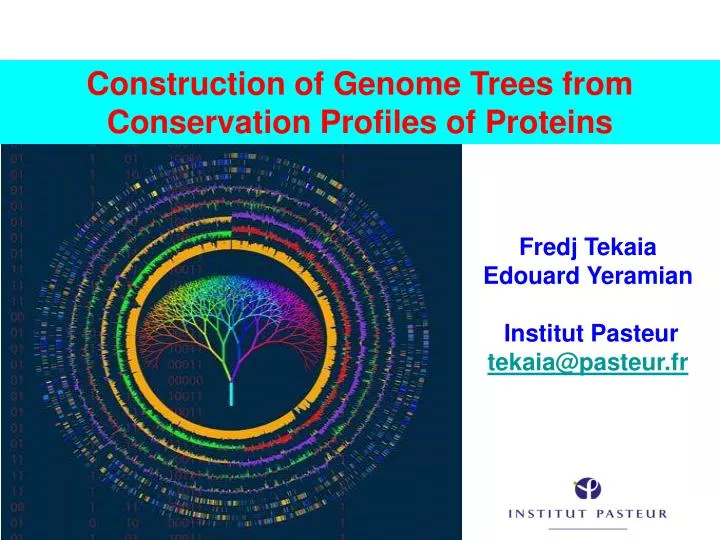
Construction of Genome Trees from Conservation Profiles of Proteins. Fredj Tekaia Edouard Yeramian Institut Pasteur tekaia@pasteur.fr. Outline. • Species tree construction and difficulties;. • Post genome era species tree construction;.

E N D
Construction of Genome Trees from Conservation Profiles of Proteins Fredj Tekaia Edouard Yeramian Institut Pasteur tekaia@pasteur.fr
Outline • Species tree construction and difficulties; • Post genome era species tree construction; • Genome tree construction based on whole proteome comparisons; • Conclusions; • References.
Species tree - Tree Of Life • 16/18s rRNA tree (Woese 1990); Woese and others have used rRNA comparisons to construct a “Tree Of Life” showing the evolutionary relationships of a wide variety of organisms. The « Tree Of Life » has long served as a useful tool for describing the history and relationships of organisms over evolutionary time. One species is represented as a branching point, or node, on the tree, and the branches represent paths of descent from a parental node.
Martin & Embley Nature 431:152-5.(2004) The two-empire proposal, separating eukaryotes from prokaryotes and eubacteria from archaebacteria. Mayr, D. PNAS 95:9720-23. (1998). The three-domain proposal based on the ribosomal RNA tree. Woese et al. PNAS. 87:4576-4579. (1990) The ring of life, incorporating lateral gene transfer but preserving the prokaryote eukaryote divide. Rivera & Lake JA. Nature 431: 152-5. (2004) The three-domain proposal, with continuous lateral gene transfer among domains. Doolittle. Science 284:2124-8. (1999)
Pennisi, E. (1998).Genome data shake tree of life. Science 280:672-4. New genome sequences are mystifying evolutionary biologists by revealing unexpected connections between microbes thought to have diverged hundreds of millions of years ago.
B A E Genome phylogeny based on gene content (1999) Snel, Bork, Huynen. Nature Genetics 21, 108-110.
Tekaia, Lazcano & Dujon (1999) Genome Research 9: 550-7. B A E
387 29 Complete genomes • 2208 projects • 460 published (14-11-06) • 1054 prokaryotes • 631 eukaryotes 44 http://www.genomesonline.org/
• Duplication Time • Duplication C A B Species tree Speciation Speciation A B C B C A Gene tree Gene tree - Species tree Genomes 2 edition 2002.. T.A. Brown
Problems with species tree construction • main difficulties in species tree construction include extensive incongruence between alternative phylogenies generated from single-gene data sets; -Genes don't evolve at the same rate nor in the same way; -the evolutionary history inferred from one gene may be different from what another gene appears to show.
Bininda-Emonds et al. 2002 Alternative solutions: integrative methods •“supertree” The supertree approach estimates phylogenies for subsets of genes with good overlap, then combines these subtree estimates into a supertree. • Depends on the ability to distinguish between orthologs and paralogs; • Supertree approaches are controversial, in part because the methodology results in a degree of disconnection between the underlying genetic data and the final tree produced.
S1 . . Sn •“phylogenomic tree” (based on concatenation of a gene sample common to the considered species); • genes don't evolve at the same rate nor in the same way; • a limited number of genes are shared among all species; The tree of one percent (2006) Dagan and Martin. Genome Biology, 7:118.
More generally these methods suffer difficulties related to the phylogenetic tree construction: • global sequence alignment (quality, gaps,...); • different evolutionary histories of genes; • substitution saturation;... and • more seriously from gene sampling difficulties.
gene tree # species tree Blue is lost in A and B Red is lost in C A A A B B B C C C Gene tree - Species tree: The gene sampling problem Adapted from: Linder, Moret, Nakhleh, Warnow. True species tree
Luckily: sampling gives the blue orthologs. The true species tree is reconstructed. A A B B C C Gene tree - Species tree: The gene sampling problem All red orthologs has been lost in the 3 species.
A B C A B C Gene trees are the same as the species tree A B C Gene tree - Species tree: The gene sampling problem All versions of the gene are in the 3 species
Genome tree is another alternative to construct species tree. • The concept of genome tree is based on overall gene content similarity.
blastp, pam250, SEG filter Proteome1 Proteome • 99 species (B: 33; A: 19; E:27) Proteomen • total of 541880 proteins Systematic Analysis of Completely Sequenced Organisms •In silico species specific comparisons (27 eucaryal, 19 archaeal and 33 bacterial species: 541880 proteins)
Methodology Fp • • 1 i p • • • • • • • 1 • • • • • • • • • • • • j kij • F1 • • • • • • • n • sup • Matrice T kij > 0 Correspondence Analysis Classification • orthogonal system; • use of euclidean distance;
Evolutionary processes include Ancestor Phylogeny* Expansion* genesis duplication species genome HGT HGT selection* Deletion* Exchange* loss • Large scale comparative analysis of predicted proteomes revealed significant evolutionary processes. Expansion, Exchange and Deletion are noise. They should be eliminated or at least reduced.
To overcome some of these limitations, we consider Genome tree construction from “Protein Conservation Profiles” and attempt to reduce noisy evolutionary processes
Conservation profiles •99 species (B: 33; A: 19; E:27); 541880 proteins p 0111111000111111111000110110111101001111101111 • A “conservation profile” is an n-component binary vector describing a protein conservation pattern across n species. Components are 0 and 1, following absence or presence of homologs. Main interesting properties of conservation profiles: • Conservation profiles are signatures of evolutionary relationships; • A conservation profile is the trace of protein evolutionary histories jointly captured in a set of n species (multidimensional feature);
Protein conservation profiles E A B S1..............I.............I................Sn G1,1 100000000000000000000000000000000000000000000000 G2,1 111111111111111111111111111111111111111111111111 G3,1111111110011111111111111011101110101111111101111 ....................................................... Gn1,1 100001110001000000000000000000000000000000000000 G1,2010000000000000000010100000000000111000011100011 G2,2010000000000000000010100000000000111000011100011 ........................................................ Gn2,2111111110011111111111111011101110101111111101111 ........................................................ G1,n 011110100000000000000000001000000000000000000001 G2,n111111110011111111100011011101110101111111101111 G3,n111111110011111111100011011101110101111111101111 ........................................................ Gnp,n100110000000000000000000000000000000000000000001 Table : 541880 proteins x 99 species • Different conservation profiles represent different evolutionary histories
100000000000000000000000000000000000000000000000 111111111111111111111111111111111111111111111111 111111110011111111111111011101110101111111101111 010000000000000000010100000000000111000011100011 100110000000000000000000000000000000000000000001 ................................................ Distinct conservation profiles 541880 original total proteins (99 species) 442460 non-specific proteins i.e conservation profiles (82%) 184130 distinct conservation profiles (42%) (one representative from each set of identical conservation profiles) • Effect of the duplication process is reduced • This set is indicative of the various observed evolutionary histories.
i j 100000000000000000000000000000000000000000000000 111111111111111111111111111111111111111111111111 111111110011111111111111011101110101111111101111 010000000000000000010100000000000111000011100011 100110000000000000000000000000000000000000000001 ................................................ Genome tree construction: data matrices • 184130 d.c.prof various evolutionary histories • Jaccard similarity scores between species sij = N11/(N11+N01+N10); N11; N01; N10 are respectively total occurrences of (1,1), (0,1) and (1,0) between i,j. T = { Tij = sij ; i=1,n; j=1,n; n}
profiles tree Tekaia F, Yeramian E. (2005). PLoS Comput Biol.1(7):e75
Conclusions: Methodology • Species classification is not an easy problem! •Species tree construction should take into account the whole information included in the genomes; • Methods that take into account whole genome informations are still needed; • Correspondence analysis method might be helpful in revealing evolutionary trends embedded in the multidimensional relationships as obtained from large scale genome comparisons;
Conclusions... •Conservation profiles represent most conserved and meaningful evolutionary signals jointly captured in a set of species; • Thus they should correspond to the most accurate type of marker for species classification; •In principal profiles tree derived from distinct conservation profiles should considerably minimize genome acquisition effects and should reflect less noisy phylogenetic signals; • The profiles tree presents evidence of conservation of stable phylogenetic relationships and reveals unconventional species clustering; •The profiles tree corresponds to the classification of the evolutionary scenari.
Acknowledgments: The support of: • The Institut Pasteur (Strategic Horizontal Programme on Anopheles gambiae) • The Ministère de la Recherche Scientifique (France): ACI-IMPBIO-2004–98-GENEPHYS program. • Bernard Dujon (Institut Pasteur).
References: •Tekaia, F. and Dujon, B. (1999). Pervasiveness of gene conservation and persistence of duplicates in cellular genomes. Journal of Molecular Evolution, 49:591-600. •Tekaia, F., Lazcano, A. and B. Dujon (1999).Genome tree as revealed from whole proteome comparisons. Genome Res. 12:17-25. • Tekaia, F., Yeramian, E. and Dujon, B. (2002). Amino acid composition of genomes, lifestyles of organisms, and evolutionary trends: a global picture with correspondence analysis.Gene 297: 51-60. • Tekaia, F. and Yeramian, E. (2005). Genome Trees from Conservation Profiles. PLoS Comput Biol.1(7):e75. • Tekaia, F. and Yeramian, E. (2006). Evolution of Proteomes: Fundamental signatures and global trends in amino acid composition. BMC Genomics (in press). •Tekaia F, Latgé JP. (2006).Aspergillus fumigatus: saprophyte or pathogen? Curr Opin Microbiol. 8:385-92. Review. • Systematic analysis of completely sequenced organisms: http://www.pasteur.fr/~tekaia/sacso.html
References: • Bininda-Emonds ORP (2005). Supertree Construction in the Genomic Age. Methods in Enzymology 395: p.745-757. • Bininda-Emonds,OPRP, John L. Gittleman, Mike A. Steel (2002) The (super)Tree Of Life: Procedures, Problems, and Prospects. Annual Review of Ecology and Systematics, Vol. 33: 265-289. • Dagan, T. and W, Martin: The tree of one percent, 2006. Genome Biology 2006, 7:118 • Delsuc F, Brinkmann H, Philippe H. (2005). Phylogenomics and the reconstruction of the tree of life. Nat Rev Genet. 6:361-75. Review. • Doolittle. Science 284:2124-8. (1999) • Amy C. Driskell, Cécile Ané, J. et al. Sciences, 306; 1172-1174. (2004) • http://www.genomesonline.org/gold.cgi (list of genome projects) • Keith A. Crandall and Jennifer E. Buhay. Sciences, 306; 1144-1145. (2004) • Linder, Moret, Nakhleh, and Warnow: http://compbio.unm.edu/networks1.ppt • Martin & Embley. Nature 431:152-5.(2004) • Pennisi, E. Genome data shake tree of life.Science. 280:672-4.(1998) • Rivera & Lake JA. Nature 431: 152-5. (2004) • Raoult et al. Sciences, 306:1344-1350. (2004) • Snel, Bork, Huynen. Genome phylogeny based on gene content (1999) Nature Genetics 21, 108-110. • Snel B, Huynen MA, Dutilh BE (2005). Genome trees and the nature of genome evolution.Annu Rev Microbiol.;59:191-209. Review. • Woese et al. PNAS. 87:4576-4579. (1990)