Download
1 / 30
300 likes | 432 Views
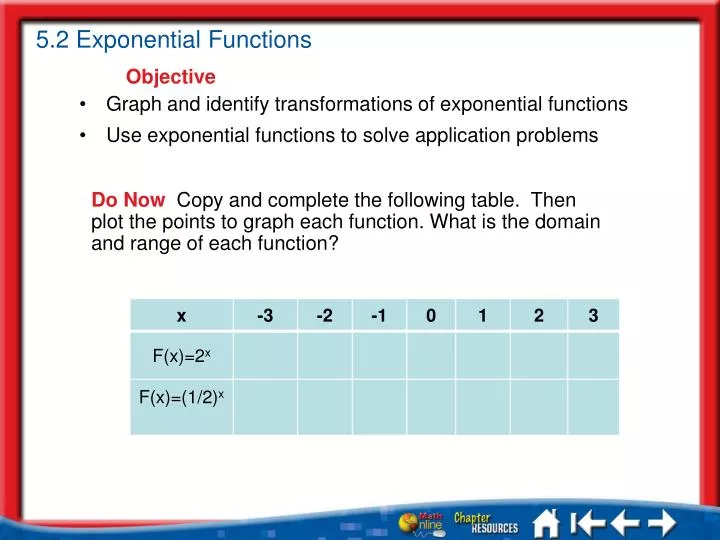
5.2 Exponential Functions. Objective. Graph and identify transformations of exponential functions Use exponential functions to solve application problems. Do Now Copy and complete the following table. Then plot the points to graph each function. What is the domain and range of each function?.

E N D
5.2 Exponential Functions Objective • Graph and identify transformations of exponential functions • Use exponential functions to solve application problems Do Now Copy and complete the following table. Then plot the points to graph each function. What is the domain and range of each function? Lesson 6 MI/Vocab
5.2 Exponential Functions Objective • Graph and identify transformations of exponential functions • Use exponential functions to solve application problems Do Now Copy and complete the following table. Then plot the points to graph each function. What is the domain and range of each function? Lesson 6 MI/Vocab
5.2 Exponential Functions General exponential function form: f(x)=ax The base of the function graphed here is 2: F(x)=2x When a>1: • The graph is above the x-axis • The y-intercept is 1 • f(x) is increasing • This is called exponential growth • f(x) approaches the negative x-axis as x approaches -∞ Lesson 1 KC1
The base of the function graphed here is 1/2: F(x)=(1/2)x When 0<a<1: • The graph is above the x-axis • The y-intercept is 1 • f(x) is decreasing • This is called exponential decay • f(x) approaches the positive x-axis as x approaches +∞
5.2 Exponential Functions • What is the role a? • When a=0, what is f(x)=ax? • What about when a=1? • What about when a<0? Consider other cases for the value of a
5.2 Exponential Functions Consider other cases for the value of a • What is the role a? • When a=0, what is f(x)=ax? • It is a constant function • What about when a=1? • It is also a constant function • What about when a<0? • It is not defined
5.2 Exponential Functions • Graphing Exploration Lab • Using a viewing window with -3≤ x ≤7 and -2≤ y ≤18, graph each function below on the same screen, and observe the behavior of each to the right of the y-axis. f(x)=1.3x g(x)=2x h(x)=10x As the graph continues to the right, which graph rises least steeply? Most steeply? How does the steepness of the graph of f(x)=ax to the right of the y-axis seem to be related to the size of the base a? Lesson 1 KC1
Graphing Exploration Lab b. Using the graphs of the same three functions in the viewing window with -4≤ x ≤2 and -0.5≤ y ≤2, observe the behavior to the left of the y-axis. f(x)=1.3x g(x)=2x h(x)=10x As the graph continues to the left, how does the size of the base a seem to be related to how quickly the graph of f(x)=ax falls toward the x-axis?
5.2 Exponential Functions Varying the Value of “a” This graph represents y=2x. A few of the most important aspects of this graph include: • the asymptotic behavior as x gets smaller and smaller. • the graph passes through the point (0,1). This is somewhat like a "vertex" for a parabola. y=2x
5.2 Exponential Functions Varying the Value of “a” The red graph represents y=5x. As you can see the graph still passes through (0,1). The only significant change to the graph is that the graph rises quicker than . Generally speaking, the larger the base, the quicker the graph rises. y=2x y=5x y=2x
5.2 Exponential Functions Varying the Value of “a” y=(1/2)x y=2x This graph represents y=(1/2)x. A fractional base causes the graph to flip over the y-axis? This can be explained if you recall some of the exponent laws. Recall that (1/2) is equal to 2-1. Thus (1/2)x can be rewritten as (2-1)x. And using exponent laws this can be finally written as 2-x which, using transformations, is the same as 2x reflected in the x direction.
5.2 Exponential Functions • What is the role of p, b, c and d? • p is the vertical stretch factor and when p is negative, the function is reflected over the x-axis • b is the horizontal stretch factor, and when b is negative, the function is reflected over the y-axis • c shifts the function horizontally • x – c shifts the graph right c units and x+c shifts the graph left c units • d shifts the function vertically • d shifts the graph up d units and -d shifts the graph down d units. Transforming Exponential Functions
First, start with the basic graph y=2x Next, reflect the graph over the x-axis to get y=-2x Last, move this graph up 3 to produce the graph for y=-2x +3 5.2 Exponential Functions Translations of Functions To graph the function y= -2x +3 we could do the following: Notice how the "vertex" point of (0,1) has moved to (0,2)and the asymptote has been translated 3 units up?
5.2 Exponential Functions • Exponential functions are useful for modeling situations in which a quantity increases or decreases by a fixed factor. • Exponential Growth • Exponential Decay Lesson 1 KC1
A.Determine whether represents exponential growth or decay. Answer: The function represents exponential growth, since the base, , is greater than 1. 5.2 Exponential Functions Identify Exponential Growth and Decay Lesson 1 Ex2
5.2 Exponential Functions Identify Exponential Growth and Decay B. Determine whether y = (0.7)x represents exponential growth or decay. Answer: The function represents exponential decay, since the base, 0.7, is between 0 and 1. Lesson 1 Ex2
5.2 Exponential Functions A. What type of exponential function is represented by y = (0.5)x? • A • B • C • D A. exponential growth B. exponential decay C. both exponential growth and exponential decay D. neither exponential growth nor exponential decay Lesson 1 CYP2
B. What type of exponential function is represented by ? 5.2 Exponential Functions • A • B • C • D A. exponential growth B. exponential decay C. both exponential growth and exponential decay D. neither exponential growth nor exponential decay Lesson 1 CYP2
5.2 Exponential Functions Applications Example 1: If you invest $10,000 in a certificate of deposit (CD) with an interest rate of 4% a year, the value of your certificate is given by f(x)=10,000(1.04)x where x is measured in years. • How much is the certificate worth in 5 years? • When will your certificate be worth $18,000?
If you invest $10,000 in a certificate of deposit (CD) with an interest rate of 4% a year, the value of your certificate is given by f(x)=10,000(1.04)x where x is measured in years. • How much is the certificate worth in 5 years? About $12,166.53 When will your certificate be worth $18,000? In about 15 yrs Note: The graph here depicts the solution found by intersection method: 18,000 = 10,000(1.04)x
5.2 Exponential Functions Example 2: The projected population of Tokyo, Japan, in millions, from 2000 to 2015 can be approximated by the function g(x)=26.4(1.0019)xwhere x=0 corresponds to the year 2000. a. Estimate the population of Tokyo in 2015. b. If the population continues to grow at is same rate after 2014, in what year will the population reach 30 millions?
Example 2: The projected population of Tokyo, Japan, in millions, from 2000 to 2015 can be approximated by the function g(x)=26.4(1.0019)xwhere x corresponds to the year 2000. • Estimate the population of Tokyo in 2015. 27.16mm b.If the population continues to grow at is same rate after 2014, in what year will the population reach 30 millions? 2067
5.2 Exponential Functions Example 3: Geologists and archeologists use carbon-14 to determine the age of organic substances, such as bones or small plants and animals found embedded in rocks. The amount from one kilogram of carbon-14 that remains after x years can be approximated by M(x)=0.99988x. Estimate the amount of carbon-14 remaining after 2000 years.
Example 3: Geologists and archeologists use carbon-14 to determine the age of organic substances, such as bones or small plants and animals found embedded in rocks. The amount from one kilogram of carbon-14 that remains after x years can be approximated by M(x)=0.99988x. Estimate the amount of carbon-14 remaining after 2000 years. About .79kg
5.2 Exponential Functions The number e and the Natural Exponential Function There is an irrational number, denoted e, that arises naturally in a variety of phenomena and plays a central role in the mathematical description of the physical universe. Its decimal expansion begins as: e=2.718281828459045… • Find the value of e1 on your calculator
5.2 Exponential Functions Since the base e is a number between 2 and 3, the graph of f(x)= ex has a steepness in between the graph of f(x)=2x and f(x)=3x .
5.2 Exponential Functions Example 4: The population of Los Angeles since 1970, in millions can be modeled by the function P(t)=2.7831e0.0096twhere t represents time in years. Assuming that this model continues to be appropriate, use it to: • estimate the population in 2010. • When will the population reach 5 million?
Example 4: The population of Los Angeles since 1970, in millions can be modeled by the function P(t)=2.7831e0.0096twhere t represents time in years. Assuming that this model continues to be appropriate, use it to: • estimate the population in 2010. 4.1 million • When will the population reach 5 million? 2031
5.2 Exponential Functions Example 5: The population of certain bacteria in a beaker at time t hours is given by the function • Graph the function and find the upper limit on the bacteria production. Upper limit?? What’s that??
5.2 Exponential Functions • The population of certain bacteria in a beaker at time t hours is given by the function • Graph the function and find the upper limit on the bacteria production. 100,000