Download
1 / 5
50 likes | 129 Views
Explore mRNA changes of 29 apoptosis-related genes in SH-SY5Y cells after 6-hour roscovitine treatment. Data obtained through RT-MLPA. Supplemental figure showing mRNA expression levels comparison in treated vs. untreated cells. Additional figures present apoptosis gene profiles in HL-60 and Jurkat cells and Western blot analysis in SH-SY5Y cells treated with different roscovitine concentrations. All data by Garrofé-Ochoa et al.

E N D
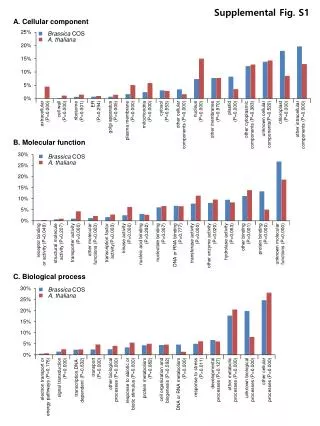
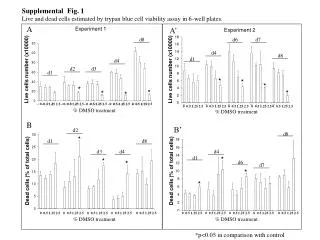
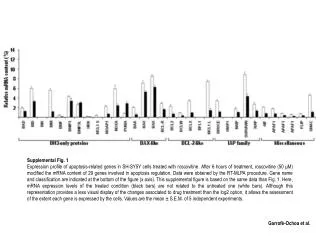
Supplemental Fig. 1 Expression profile of apoptosis-related genes in SH-SY5Y cells treated with roscovitine. After 6 hours of treatment, roscovitine (50 μM) modified the mRNA content of 29 genes involved in apoptosis regulation. Data were obtained by the RT-MLPA procedure. Gene name and classification are indicated at the bottom of the figure (x axis). This supplemental figure is based on the same data than Fig. 1. Here, mRNA expression levels of the treated condition (black bars) are not related to the untreated one (white bars). Although this representation provides a less visual display of the changes associated to drug treatment than the log2 option, it allows the assessment of the extent each gene is expressed by the cells. Values are the mean ± S.E.M. of 5 independent experiments. Garrofé-Ochoa et al.
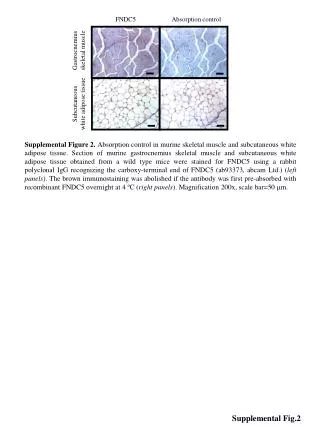
Supplemental Fig. 2 The cell lines stated in the image were treated with Roscovitine (50M) for 24 hours or left untreated. Then cells were subjected to direct bisBenzimide staining and fluorescence microscopy. Bar = 10M. Garrofé-Ochoa et al.
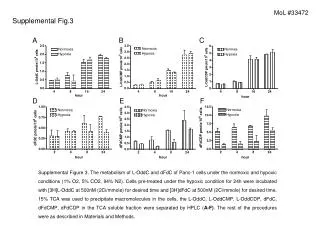
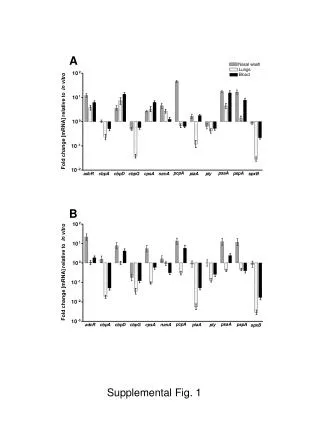
Supplemental Fig. 3 Expression profile of apoptosis-related genes in HL-60 cells treated with roscovitine. HL-60 cells were treated (black bars) for 6 hours with roscovitine (50 µM) or left untreated (white bars). Then total RNA was extracted and subjected to RT-MLPA analysis. This supplemental figure is based on identical data than Fig. 3D. However, the quantification of mRNA has been performed as reported in the legend of supplemental Fig. 1 Garrofé-Ochoa et al.
Supplemental Fig. 4 Expression profile of apoptosis-related genes in Jurkat cells treated with roscovitine. Jurkat cells were treated (black bars) for 6 hours with roscovitine (50 µM) or left untreated (white bars). Then total RNA was extracted and subjected to RT-MLPA analysis. This supplemental figure is based on identical data than Fig. 3D. However, the quantification of mRNA has been performed as reported in the legend of supplemental Fig. 1 Garrofé-Ochoa et al.
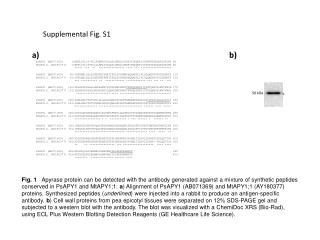
Supplemental Fig. 5 Western blot images representative of those processed by densitometry to generate Fig. 5 and 6. SH-SY5Y cells were treated with sublethal (10M) and lethal (50M) concentrations of roscovitine for the time stated in the image. Then proteins extracts were performed and subjected to Western blot to analyze the content of the proteins indicated in the image. GAPDH was used to assess the amount of protein loaded per lane. Garrofé-Ochoa et al.