Download
1 / 22
220 likes | 433 Views
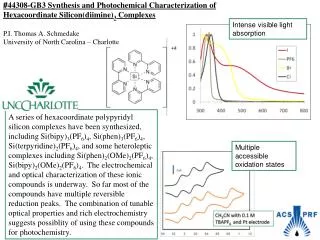
Bios 532 Laboratory Module on UV-Visible Light Absorption Spectroscopy. Absorption Spectroscopy. The Beer-Lambert Law A= lc Where A is absorbance or optical density (no units, since A = log [I 0 /I]); is the molar absorptivity with units of (L mol -1 cm -1 );

E N D
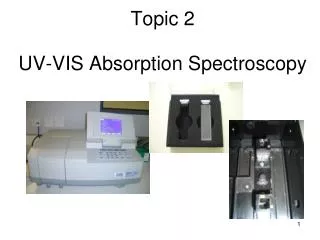
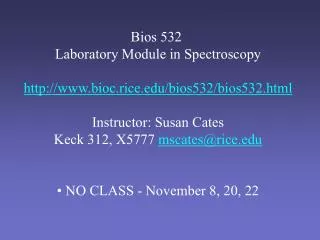
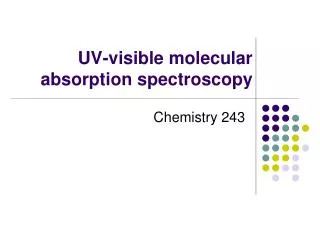
Bios 532 Laboratory Module on UV-Visible Light Absorption Spectroscopy
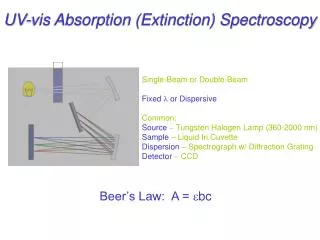
Absorption Spectroscopy The Beer-Lambert Law A=lc Where A is absorbance or optical density (no units, since A = log [I0/I]); is the molar absorptivity with units of (L mol-1 cm-1); l is the path length of the sample - that is, the interior dimension (cm) of the cuvette in which the sample is contained, parallel to the light path; c is the concentration of the compound in solution, expressed in (mol L-1).
Molar Absorptivity A = lc is a measure of the amount of light absorbed per unit concentration. Molar absorptivity is a constant for a particular substance, so if the concentration of the solution is halved, so is the absorbance at dilute concentrations. A concentration
Limitations A = bc this relationship fails at extremely high concentrations • deviations in absorptivity coefficients at high concentrations (>0.01M) due to electrostatic interactions between molecules in close proximity • changes in refractive index at high analyte concentration • shifts in chemical equilibria as a function of concentration A concentration
Limitations Absorbance (A) versus the measured transmission (%T): A sample which allows 100% of the selected light to be transmitted clearly has zero absorbance. A sample which allows 0% transmittance exhibits infinite absorbing power: ∞ = A . These limits are properly accounted for through the following logarithmic relationship between absorbance and percent transmittance: A = - log (%T /100)
Errors in %T readings which are too low (e.g., below ~12%) or too high (e.g., above ~70%) are significantly magnified in their corresponding A values. Design experiments so that only samples with %T values above 12% and below 70% are prepared and measured. This corresponds to solutions with absorbance values A between ~ 0.16 and 0.92. Limitations A = - log (%T /100) Review of these principles can be found on-line in the US Naval Academy Dept. of Chemistry General Chemistry Laboratory Manual: http://www.chemistry.usna.edu/manual/ApdxI.pdf.
Spectroscopic light sources - terms • monochromatic light - light of a single, constant wavelength. • coherent light - wavelengths are in phase in space and time. • white light is a mixture of all the colors of the visible spectrum, • which includes light with wavelengths of 400 - 700 nm. • ordinary light (emitted from the everyday light bulb, the sun, a candle) will consist of wavetrains of unrelated phases, frequency and polarization in all directions. • in contrast, laser light is monochromatic, directional and coherent.
Light Source in the Shimadzu Specs The halogen visible light source - typical spectral emission range for a halogen lamp is ~ 300 -1100 nm. The deuterium UV light source - typical spectral emission range is ~ 180 - 500 nm. Switching between the two light sources is performed automatically by the spec, according to a pre-selected switching wavelength that has been chosen at installation. The switching wavelength is usually somewhere between 280 - 390 nm.
Difference Spectroscopy • Two solutions are compared - usually start out identical. • All common spectral features cancel out. • Reference solution is unperturbed. • The sample solution is varied by additives. • Double-beam operation - the spec does the subtraction (the Shimadzu specs have a beam chopper).
Difference Spectroscopy The chopper resembles a fan that allows light to pass for a characteristic period of time, then blocks the light for the same time period. The unblocked signal is reference + sample, the blocked signal is reference only. The difference between these two signals (blocked and unblocked) must be the desired analytical signal.
beam chopper - an optical chopper is a mechanical or electromagnetic device for passing and then interrupting a beam of light for a known brief interval. Examples include tuning forks, rotating shutters and the more sophisticated Kerr cells. • monochromator -an instrument for isolating narrow portions of the spectrum The spectrum of any light source is formed by a prism or grating, and an exit slit placed in the spectrum selects a narrow band of wavelengths for emission. By moving the spectrum of a source internally past the slit, the color of the emitted light can be varied at will. As most monochromators emit several percentages of unwanted light -- either white or of the wrong wavelength -- along with the desired wavelength, two monochromators often are used in tandem, both being set to transmit the same wavelength. In this way the percentage of unwanted light can be reduced drastically.
monochromators 1. Grating monochromator - uses a diffraction grating as the dispersive element that is a ray of fine, parallel, equally spaced reflecting or transmitting lines that mutually enhance the effects of diffraction to concentrate the diffracted light in specific directions determined by the spacing of the lines and by the wavelength of the light. 2. Crystal monochromator - the crystal lattice serves as a 3-dimensional diffraction grating that separates light by wavelength (think prism).
Factors other than sample path length and sample concentration that can affect absorbance • reflections at the cuvette interface • scratches, fingerprints on the cuvette • absorptive materials in buffer (non-sample) • fluorescence (increases apparent intensity) • high sample concentrations • change in the chemical properties of the sample
Hemoglobin A B 1 2 Fe D C 1 2
Methemoglobin Fe(II)-heme is oxidized to Fe(III)-heme to form metHb. MetHb does not bind O2. At low pH, H2O occupies the space between the Fe and the distal histidine - aquomethemoglobin. At high pH, Fe binds OH- - hydroxymethemoglobin. oxy-Hb met-Hb
When a ligand is bound to Hb, the heme iron is 6-coordinated.
Absolute Spectrum of Methemoglobin oxyHb low spin ß 500 metHb/CN low spin deoxyHb high spin aquometHb high spin 630 ß 490-510 600-630
High Spin State vs. Low Spin State Elemental Fe [Ar]3d64s2 Fe2+ (ferrous) [Ar]3d6 Fe3+ (ferric) [Ar]3d5 metHb- low pH- high pH- If there +H2O +OH - were no ligands 1/2 1/2 1/2 1/2 1/2 1/2 - 1/2 1/2 1/2 - 1/2 5/2 high spin 1/2 low spin
Absolute Spectrum of Methemoglobin ß 500 low spin high spin 630 ß 490-510 600-630
Inositol hexaphosphoric acid (IP6 or phytic acid) binding to met Hb: Physiological relevance - the binding of organic phosphates to ferrohemoglobin results in a decrease in oxygen affinity, linking erythrocyte metabolism to gas transport. IP6 binding causes a change in spin character of ß chain hemes.
p-hydroxymercuribenzoate (pMB) binding to met Hb ß - Cys 93 145 92 93 146 94 subunit in red pMB binding changes the spin character of met Hb
Remember • KCN, NaN3, PMB, NaF are all toxic. (NaF eats glass when wet.) • Use a reference cell or a baseline reading for subtracting buffer. • Save all files in the directory UVPC:Data:Bios532. • All buffers, chemicals are pre-prepared, use only what you need. • Store buffers, chemicals, protein solutions in 4C between labs. • Clean cuvettes with ethanol, air dry. • Rinse syringes with millipore H2O.