Download
1 / 19
210 likes | 357 Views
Deconvolution of Laser Scanning Confocal Microscopy Volumes: Empirical determination of the point spread function . Eyal Bar- Kochba ENGN2500: Medical Imaging Professor Kimia. What is Laser Scanning Confocal Microscopy (LSCM)?. Anatomy of the Spine. Working operation of the LSCM [1].

E N D
Deconvolution of Laser Scanning ConfocalMicroscopy Volumes: Empirical determination of the point spread function EyalBar-Kochba ENGN2500: Medical Imaging Professor Kimia
What is Laser Scanning Confocal Microscopy (LSCM)? Anatomy of the Spine Working operation of the LSCM [1] Light is captured by scanning the focused beams of laser light across the specimen. Enables the collection of true 3-D data of specimens with multiple labels. Out-of-plane light is blocked by the detector pinhole aperture. Allows visualization of deeper structures of specimen. Higher resolution than standard widefield microscope.
High resolution images taken with LSCM Nueron after segmentation [3] Minimal spatial blurring of fibroblast images [2] Image of volume stack [2]
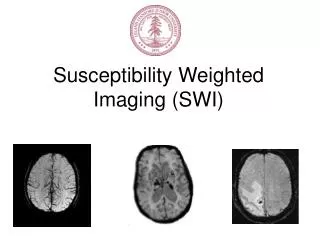
The inherent issue with optical microscopes: The point spread function Any optical microscopes response to an object that is a point source and under the resolution is point spread function (PSF). The PSF is highly dependant on the hardware of your imaging system, e.g. objective, imaging temperature, fluorescence color, etc… Any image formed is the convolution of the object with the PSF. Idealized PSF of a LSCM : X-Z has worse spatial blurring
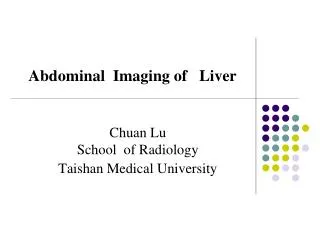
Convolution of the object with the PSF is reversible in principle by taking the inverse FT of the result. However, due to inherent noise in the system, the inverse FT would simply amplify the noise. Also, the PSF for your specific system would have to be accurately known for every experiment. Deconvolution mitigates blurring due to the PSF Blurred Image Deconvoluted Image Restored Volume Blurred Volume
To deconvolve the data, a good estimate of the PSF must be known for every system. The biological specimens imaged in the Franck Lab contained fluorescent beads (500 nm diameters) that are used to do Digital Volume Correlation (DVC). DVC allows us to look at the traction forces that cells impose on there three dimensional environment. Conveniently, these Fluorescent beads can be used to determine the PSF of the system because they are under the resolution of microscope. Statistical determination of the PSF from micro-fluorescent beads. Volume obtained used LSCM in lab. The yellow particles are the fluorescent beads that can be seen as PSF.
Window size for each bead was determined by: finding maximum intensity of volume, starting at the point of maximum intensity, scanning across x, y, and z lines until 10% of maximum intensity was found, and determining volume from the scan and subsequently adding padding. Determine window size for each bead X-Y Y-Z
During search for the beads, two filters were passed Filter 1: To filter out low intensity peaks: Filter 2: To filter out lumped beads: Filtering “irregular” shaped bead volume “Irregular shaped bead volume Iso-surface of irregular shaped bead volume
Each bead sub-volume was fitted to a 3D Gaussian distribution using a Lease-Squares fit: Fitting each bead to 3D Gaussian Distribution • The PSF’s theoretical solution for the confocal microscope is the Gaussian distribution [7]. Nine beads before fitting Nine beads after fitting
The PSF was determined by imputing the average of each fitting parameter to a 3D Gaussian distribution: Averaging the fitting parameters to determine the PSF. X-Z PSF for current configuration of microscope X-Y Y-Z
PSF and volume will be fed into an iterative based deconvolution developed by Lucy-Richardson (LR) in 1972 [11]. The LR deconvolution is implemented in the “Deconvolution Lab” plugin within ImageJ [12]. The LR deconvolution maximizes the probability that the output image that is convolved with the PSF is an instance of the blurred image. When the best compromise between image detail enhancement and noise has been reached, the iterations are stopped. This algorithm is good in mitigating background noise in the image because the model assumes a Poisson distributed of noise. Computationally efficient compared to other methods. Many other methods of deconvolution are available. Lucy-Richardson deconvolution
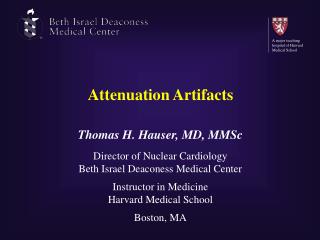
To test the validity of the LR deconvolution, a ground truth image was convoluted with a known PSF. A 100 iteration deconvolution was then preformed using LR deconvolutionand consequently compared to the ground truth image. Validation of the LR dconvolution * = PSF *-1 Ground truth image Blurred image = PSF Deblurred image
Deconvolution of volume with beads. Deblurred volume containing beads after deconvolution (10 iterations) Blurred volume containing beads beforedeconvolution
Blurred volume stack of neurons taken using LSCM Blurred volume (512x512x66) of an aggregate of neurons seeded on a Polyacrylamidesubstrate.
Deconvoluted volume stack of neurons taken using LSCM (10 iterations) 10 iterations of the LR deconvolutionon the previous volume stack of neurons (~1.5 minutes per channel).
Deconvoluted volume stack of neurons taken using LSCM (100 iterations) • 100 iterations of the LR deconvolutionon the previous volume stack of neurons (14 minutes per channel).
Sum of intensities projection. Sum of intensity projection of volume stack of neurons (deblurred) Sum of intensity projection of volume stack of neurons (blurred)
The PSF was determined using a statistical averaging of micro-fluorescent beads within a volume taken with LSCM. The PSF and microscope image was deconvoluted using LR deconvolutionin ImageJ. A sharper image was produced with more iterations but loss of image color became increasingly worse. Future work: Selfcontain the whole deconvolution procedure within MATLAB. Thank you for your time. Conclusions
References • [1]"Confocal Microscopy." The John Innes Centre. Web. 29 Apr. 2011. <http://www.jic.ac.uk/microscopy/more/T5_8.htm>.. • [2] "Image of a double-labeled cell culture (right).."Microscopic and Microanalysis services. Web. 28 Apr 2011. <http://www.uku.fi/biomater/palvelut/mikroskopia_en.shtml>. • [3 Losavio, B. E., Y. Liang, A. Santamaria-Pang, I. A. Kakadiaris, C. M. Colbert, and P. Saggau. "Live Neuron Morphology Automatically Reconstructed From Multiphoton and Confocal Imaging Data." Journal of Neurophysiology 100.4 (2008): 2422-429. Web. • [4] "Point spread function." ImageSurfer. Web. 28 Apr 2011. <http://imagesurfer.cs.unc.edu/help/users-guide.html>. • [5] Pankajakshan, Praveen, Bo Zhang, Laure Blanc-Féraud, ZviKam, Jean-Christophe Olivo-Marin, and JosianeZerubia. "Blind Deconvolution for Thin-layered ConfocalImaging."Applied Optics 48.22 (2009): 4437. Web. • [6] Pawley, James B. Handbook of Biological Confocal Microscopy. New York, NY: Springer, 2006. Web. • [7] Zhang, Bo, JosianeZerubia, and Jean-Christophe Olivo-Marin. "Gaussian Approximations of Fluorescence Microscope Point-spread Function Models." Applied Optics 46.10 (2007): 1819. Web. • [8] Luisier, Florian, CédricVonesch, Thierry Blu, and Michael Unser. "Fast Interscale Wavelet Denoising of Poisson-corrupted Images." Signal Processing 90.2 (2010): 415-27. Web. • [9] Dupe, F.-X., J.M. Fadili, and J.-L. Starck. "A Proximal Iteration for Deconvolving Poisson Noisy Images Using Sparse Representations." IEEE Transactions on Image Processing18.2 (2009): 310-21. Web. • [10] Buades, A., B. Coll, and J. M. Morel. "A Review of Image Denoising Algorithms, with a New One." Multiscale Modeling & Simulation 4.2 (2005): 490. Web. • [11] Richardson, William Hadley. "Bayesian-Based Iterative Method of Image Restoration." Journal of the Optical Society of America 62.1 (1972): 55. Web. • [12] Vonesch, Cédric, Raquel T. Cristofani, and Guillaume Schmit. ImageJ: Deconvolution Lab. Computer software. 3D Deconvolution Package for Microscopic Images. Biomedical Image Group (BIG), ÉCOLE POLYTECHNIQUE FÉDÉRALE DE LAUSANNE. Web. <http://bigwww.epfl.ch/algorithms/deconvolutionlab/>.