Download
1 / 1
10 likes | 113 Views
STATEMENT OF PROBLEM. BOSTON. CUTLER. FIG 1: EKMAN TRANSPORT AND STUDY AREA. PORTLAND. Ekman Transport and Tidal Variations in the Gulf of Maine Norman J. Shippee Judd Gregg Meteorology Institute at Plymouth State University (http://vortex.plymouth.edu)

E N D
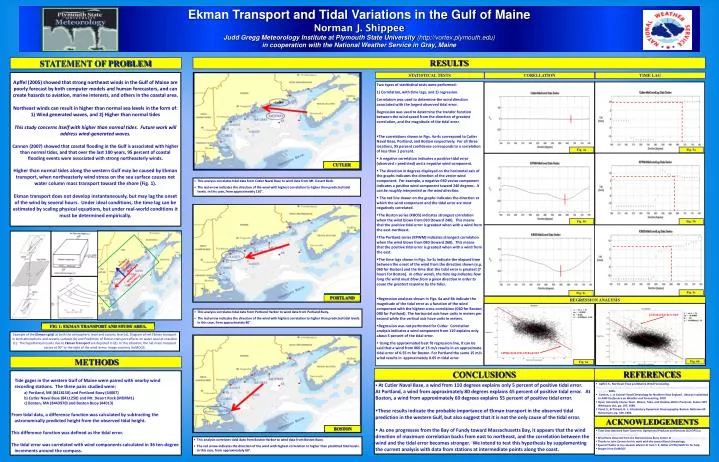
STATEMENT OF PROBLEM BOSTON CUTLER FIG 1: EKMAN TRANSPORT AND STUDY AREA. PORTLAND Ekman Transport and Tidal Variations in the Gulf of Maine Norman J. Shippee Judd Gregg Meteorology Institute at Plymouth State University (http://vortex.plymouth.edu) in cooperation with the National Weather Service in Gray, Maine RESULTS STATISTICAL TESTS CORELLATION TIME LAG Apffel (2005) showed that strong northeast winds in the Gulf of Maine are poorly forecast by both computer models and human forecasters, and can create hazards to aviation, marine interests, and others in the coastal area. Northeast winds can result in higher than normal sea levels in the form of: 1) Wind generated waves, and 2) Higher than normal tides This study concerns itself with higher than normal tides. Future work will address wind-generated waves. Cannon (2007) showed that coastal flooding in the Gulf is associated with higher than normal tides, and that over the last 100 years, 95 percent of coastal flooding events were associated with strong northeasterly winds. Higher than normal tides along the western Gulf may be caused by Ekman transport, when northeasterly wind stress on the sea surface causes net water column mass transport toward the shore (Fig. 1). Ekman transport does not develop instantaneously, but may lag the onset of the wind by several hours. Under ideal conditions, the time lag can be estimated by scaling physical equations, but under real-world conditions it must be determined empirically. • Two types of statitistical tests were performed: • 1) Correlation, with time lags, and 2) regression. • Correlation was used to determine the wind direction associated with the largest observed tidal error. • Regression was used to determine the transfer function between the wind speed from the direction of greatest correlation, and the magnitude of the tidal error. • The correlations shown in Figs. 4a-4c correspond to Cutler Naval Base, Portland, and Boston respectively. For all three locations, 95 percent confidence corresponds to a correlation of less than 1 percent. • A negative correlation indicates a positive tidal error (observed > predicted) and a negative wind component. • The direction in degrees displayed on the horizontal axis of the graphs indicates the direction of the vector wind component. For example, a negative 060 vector component indicates a positive wind component toward 240 degrees. It can be roughly interpreted as the wind direction. • The red line drawn on the graphs indicates the direction at which the wind component and the tidal error are most negatively correlated. • The Boston series (KBOS) indicates strongest correlation when the wind blows from 060 (toward 240). This means that the positive tidal error is greatest when with a wind from the east-northeast. • The Portland series (KPWM) indicates strongest correlation when the wind blows from 080 (toward 260). This means that the positive tidal error is greatest when with a wind from the east. • The time lags shown in Figs. 5a-5c indicate the elapsed time between the onset of the wind from the direction shown (e.g. 060 for Boston) and the time that the tidal error is greatest (7 hours for Boston). In other words, the time lag indicates how long the wind must blow from a given direction in order to cause the greatest response by the tides. • Regression analyses shown in Figs. 6a and 6b indicate the magnitude of the tidal error as a function of the wind component with the highest cross-correlation (060 for Boston; 080 for Portland). The horizontal axis have units in meters per second while the vertical axis have units in meters. • Regression was not performed for Cutler. Correlation analysis indicates a wind component from 110 explains only about 5 percent of the tidal error. • Using the approximated best fit regression line, it can be said that a wind from 060 at 15 m/s results in an approximate tidal error of 0.55 m for Boston. For Portland the same 15 m/s wind results in approximately 0.65 m tidal error. Fig. 4a Fig. 5a • This analysis correlates tidal data from Cutler Naval Base to wind data from Mt. Desert Rock. • The red arrow indicates the direction of the wind with highest correlation to higher than predicted tidal levels. In this case, from approximately 110°. Fig. 4b Fig. 5b (a) (b) (d) Net mass transport towards shore Wind from the Northeast (c) Fig. 5c Fig. 4c REGRESSION ANALYSIS • This analysis correlates tidal data from Portland Harbor to wind data from Portland Buoy. • The red arrow indicates the direction of the wind with highest correlation to higher than predicted tidal levels. In this case, from approximately 80°. ESTIMATED BOUNDS Example of the Ekman spiral at both the atmospheric level and oceanic level (a), Diagram of net Ekman transport in both atmospheric and oceanic surfaces (b) and Prediction of Ekman transport effects on water level at coastline (c). The hypothetical results due to Ekman Transport are depicted in (d). In this situation, the net mass transport occurs at 90° to the right of the wind stress. Image courtesy GoMOOS. APPROXIMATE LINEAR FIT METHODS Fig. 6b Fig. 6a REFERENCES CONCLUSIONS Tide gages in the western Gulf of Maine were paired with nearby wind recording stations. The three pairs studied were: a) Portland, ME (8418150) and Portland Buoy (44007) b) Cutler Naval Base (8411250) and Mt. Desert Rock (MDRM1) c) Boston, MA (8443970) and Boston Buoy (44013) From tidal data, a difference function was calculated by subtracting the astronomically predicted height from the observed tidal height. This difference function was defined as the tidal error. The tidal error was correlated with wind components calculated in 36 ten-degree increments around the compass. • At Cutler Naval Base, a wind from 110 degrees explains only 5 percent of positive tidal error. At Portland, a wind from approximately 80 degrees explains 45 percent of positive tidal error. At Boston, a wind from approximately 60 degrees explains 55 percent of positive tidal error. • These results indicate the probable importance of Ekman transport in the observed tidal prediction in the western Gulf, but also suggest that it is not the only cause of the tidal error. • As one progresses from the Bay of Fundy toward Massachusetts Bay, it appears that the wind direction of maximum correlation backs from east to northeast, and the correlation between the wind and the tidal error becomes stronger. We intend to test this hypothesis by supplementing the current analysis with data from stations at intermediate points along the coast. • Apffel, K., Northeast Flow and Marine Wind Forecasting. • http://vortex.plymouth.edu/~stmiller/stmiller_content/Research/KGYX/Apffel_Presentation.ppt. 2005. • Cannon, J., A Coastal Flood Climatology for Northern New England. Abstract submitted to AMS Conference on Weather and Forecasting, 2007 • Open University Course Team. Waves, Tides, and Shallow-Water Processes. Exeter: BPC Wheatons Ltd., pp. 187, 1989. • Pond, S., & Pickard, G. L. Introductory Dynamical Oceanography. Boston: Butterworth Heinemann, pp. 329, 1983. ACKNOWLEDGEMENTS • Tidal Data obtained from Center for Operational Products and Services (CO-OPS) at http://tidesandcurrents.noaa.gov • Wind Data obtained from the National Data Buoy Center at http://www.ndbc.noaa.gov • Thanks to John Cannon for his work with the coastal flood climatology. • Special Thanks to my research advisor Dr Sam T. K. Miller of PSU/JGMI for his help. • Images from GoMOOS • This analysis correlates tidal data from Boston Harbor to wind data from Boston Buoy. • The red arrow indicates the direction of the wind with highest correlation to higher than predicted tidal levels. In this case, from approximately 60°.