Download
1 / 49
600 likes | 1.29k Views
Aquatic Ecosystems. Chapter 7. Aquatic Environments: Types and Characteristics. Aquatic life zones Saltwater Freshwater. The Aquatic World. Fig. 5-23a, p. 96. Organisms in Aquatic Life Zones. Phytoplankton Zooplankton Nekton- Strong swimming (fish, sharks, etc.)

E N D
Aquatic Ecosystems Chapter 7
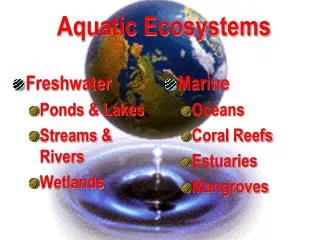
Aquatic Environments: Types and Characteristics • Aquatic life zones • Saltwater • Freshwater
The Aquatic World Fig. 5-23a, p. 96
Organisms in Aquatic Life Zones • Phytoplankton • Zooplankton • Nekton-Strong swimming (fish, sharks, etc.) • Benthos-Bottom-dwelling (crabs, shellfish, worms) • Decomposers Free floating
Factors that Limit Life with Water Depth • Temperature • Sunlight (photosynthesis, euphotic zone) • Dissolved oxygen content • Availability of nutrients(like phosphorus and nitrates- net primary productivity)
Saltwater Life Zones • Open ocean • Coastal zone • Estuaries • Coastal wetlands • Mangrove swamps • Intertidal zones (rocky shores and barrier beaches) • Coral reefs
Major Life Zones in the Ocean High tide Open Sea Sun Low tide Coastal Zone Sea level Euphotic Zone Photosynthesis Estuarine Zone Continental shelf Bathyal Zone Twilight • Biological Zones in Open Sea: • Euphotic zone • Bathyal zone • Abyssal zone Abyssal Zone Darkness Fig. 5-26, p. 98
Marine Ecosystems Natural Capital Marine Ecosystems EcologicalServices EconomicServices Climate moderation CO2 absorption Nutrient cycling Waste treatment and dilution Reduced storm impact (mangrove, barrier islands, coastal wetlands) Habitats and nursery areas for marine and terrestrial species Genetic resources and biodiversity Scientific information Food Animal and pet feed (fish meal) Pharmaceuticals Harbors and transportation routes Coastal habitats for humans Recreation Employment Offshore oil and natural gas Minerals Building materials Fig. 5-25, p. 97
Estuaries • Where freshwater and saltwater meet. • Highly variable environment (salinity, temperature, light penetration rapidly changes). • Many fishes and shellfish spend larval stages here.
Sediment Plume in an Estuary Madagascar’s Betsiboka River flowing into Mozambique Channel Fig. 5-27, p. 98
2)Mangrove forests Estuaries 1) Salt marshes Two general types:
Salt Marsh in Lake Titicaca, Peru Fig. 5-28b, p. 99
Salt Marsh Ecosystem Herring gulls Peregrine falcon Producer to primary consumer Snowy egret Cordgrass Short-billed dowitcher Primary to secondary consumer Marsh periwinkle Secondary to higher-level consumer Phytoplankton Smelt All producers and consumers to decomposers Zooplankton and small crustaceans Soft-shelled clam Clamworm Bacteria Fig. 5-28a, p. 99
Marine Ecosystems • Intertidal Zone
Beach Organisms Hermit crab Shore crab Sea star Rocky Shore Beach High tide Periwinkle Sea urchin Anemone Mussel Low tide Sculpin Barnacles Kelp Sea lettuce Monterey flatworm Nudibranch Fig. 5-29a, p. 101
Beach Organisms Barrier beach Beach flea Peanut worm Tiger beetle Blue crab Clam Dwarf olive High tide Sandpiper Ghost shrimp Silversides Low tide Mole shrimp White sand macoma Sand dollar Moon snail Fig. 5-29b, p. 101
Primary and Secondary Beach Dunes Ocean Beach Intensive recreation, no building Primary Dune No direct passage or building Trough Limited recreation and walkways Secondary Dune No direct passage or building Back Dune Most suitable for development Bay or Lagoon Intensive recreation Bay shore No filling Grasses or shrubs Taller shrubs Taller shrubs and trees Fig. 5-30, p. 102
Coral Reef Ecosystem Gray reef shark Green sea turtle Sea nettle Producer to primary consumer Fairy basslet Blue tangs Primary to secondary consumer Parrot fish Sergeant major Brittle star Banded coral shrimp Hard corals Algae Secondary to higher-level consumer Phytoplankton Coney Symbiotic algae Zooplankton Blackcap basslet All producers and consumers to decomposers Sponges Moray eel Bacteria Fig. 5-31, p. 102
Major Threats to Coral Reefs Natural Capital Degradation Coral Reefs Ocean warming Soil erosion Algae growth from fertilizer runoff Mangrove destruction Coral reef bleaching Rising sea levels Increased UV exposure from ozone depletion Using cyanide and dynamite to harvest coral reef fish Coral removal for building material, aquariums, and jewelry Damage from anchors, ships, and tourist divers Fig. 5-32, p. 103
Human Impacts on Marine Ecosystems Natural Capital Degradation Marine Ecosystems Half of coastal wetlands lost to agriculture and urban development Over one-third of mangrove forests lost since 1980 to agriculture, development, and aquaculture shrimp farms About 10% of world’s beaches eroding because of coastal development and rising sea level Ocean bottom habitats degraded by dredging and trawler fishing boats Over 25% of coral reefs severely damaged and 11% have been destroyed Fig. 5-33, p. 103
Aquatic Ecosystems • Human Impacts on the Ocean
Aquatic Ecosystems • Human Impacts on the Ocean
Freshwater Life Zones • Standing (lentic) water - lakes and ponds • Flowing (lotic) water - streams and rivers
Major Services of Freshwater Systems Natural Capital Freshwater Systems EcologicalServices EconomicServices Food Drinking water Irrigation water Hydroelectricity Transportation corridors Recreation Employment Climate moderation Nutrient cycling Waste treatment and dilution Flood control Groundwater recharge Habitats for aquatic and terrestrial species Genetic resources and biodiversity Scientific information Where does our freshwater come from??? Fig. 5-34, p. 104
Zones in a Temperate Lake Sunlight Painted turtle Green frog Blue-winged teal Muskrat Pond snail Littoral zone Limnetic zone Diving beetle Plankton Profundal zone Benthic zone Northern pike Yellow perch Bloodworms Fig. 5-35, p. 105
Highly productive, high species richness Photosynthetically productive; large fish Freshwater Ecosystems • Lakes and Ponds
Not always present; anaerobic, dominated by decomposers Freshwater Ecosystems • Lakes and Ponds
Freshwater Ecosystems Thermal stratification in temperate lakes
Freshwater Ecosystems • Turnover in temperate lakes
Nutrient effects on lakes and streams Oligotrophic- nutrient poor, therefore low net primary productivity; clear blue-green water Eutrophic-nutrient rich with nitrates and phosphates; lead to increase algae and excessive growth of producers; murky brown or green water with poor visibility.
Humans accelerate eutrophication of lakes and streams • Animation of river eutrophication
Freshwater Streams and Rivers • Surface water-precipitation that does not sink into the ground. • Runoff • Watershed or drainage basin-area of land where rivers and streams come together(river basin- all the water drains into a large river) • *Aquifers-porous, water-saturated layers of sand, gravel or bedrock that are filled from surface water percolating down through the sediments. • *Water table-upper surface of the zone of saturation , where all pores between sediment particles are filled with water.
Flowing water zones- (Planet Earth) • Source: Tend to be narrow, swift, clear, cold, nutrient poor, and highly oxygenated; not very productive • Transition: warmer, wider, deeper streams, support more producers than source zone • Floodplain: Tend to be wide, deeper river meet valleys. slow, cloudy, warm, nutrient rich, and less oxygenated; large levels of algae, aquatic plant
Stream Zones Rain and snow Lake Glacier Rapids Waterfall Tributary Flood plain Oxbow lake Salt marsh Ocean Delta Deposited sediment Source Zone Transition Zone Water Sediment Floodplain Zone Fig. 5-36, p. 106
Freshwater Inland Wetlands • Importance of inland wetlands • Natural sponges/ remove pollutants • Diverse habitats • Types of wetlands • Marshes (dominated by grasses/reeds) • Swamps (dominated by trees/shrubs) • Prairie potholes (depressions carved out by glaciers) • Floodplains • Arctic tundra (in summer) • Seasonal wetlands
Freshwater Ecosystems • Marsh • Freshwater Swamps
Freshwater Ecosystems • Floodplain- Mississippi River Prairie potholes
Freshwater Ecosystems Artic tundra- Alaska in summer
Human Impacts on Freshwater Systems • Dams, diversions and canals - Animation • Flood control levees and dikes • Pollutants from cities and farmlands • Wetland destruction
Interaction of Life Zones • Case-in-Point: The Everglades
What are the Everglades? Used to cover over 11,000 square miles flowing from Kissimmee River to Lake Okeechobee, and then south through the Everglades to Florida Bay (KOE watershed) Spans up to 60 miles in width, but can be only 6 inches in depth in some areas Considered a hot spot of biodiversity Only area in the world where Alligators and Crocodiles exist side by side Nicknamed “River of Grass” (Marjorie Stoneman Douglas)
History of the Everglades 1905- FL governor Napoleon Bonaparte Broward began the push to drain the Everglades Miami and Ft. Lauderdale were created when tracts of land were drained into farmland 1948- Central and South Florida Project (US congress)-- created man-made canals and levees moving over 1 billion gallons of water daily into the ocean The Everglades is now one half of the size it used to be due to this change
What is being done? • CERP (Comprehensive Everglades Restoration Plan) • 30 year, $10.9 billion • 50-50 partnership with FL and US govts • Improve water quality and water flow Flow maps
The major CERP Plan components : Surface Water Storage Reservoirs Water Preserve Areas Management of Lake Okeechobee as an Ecological Resource Improved Water Deliveries to the Estuaries Underground Water Storage Treatment Wetlands Improved Water Deliveries to the Everglades Removal of Barriers to Sheetflow Storage of Water in Existing Quarries Reuse of Wastewater Improved Water Conservation Additional Feasibility Studies