Download
1 / 43
430 likes | 602 Views
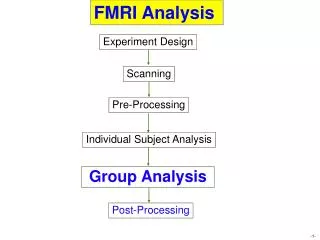
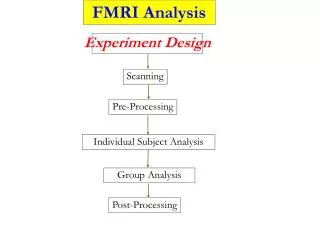
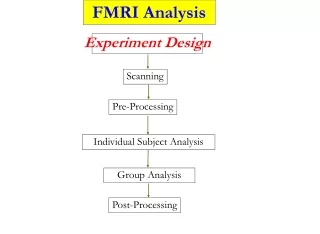
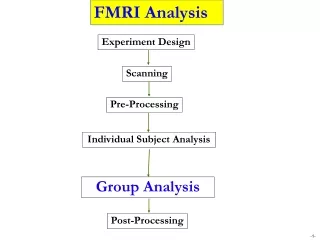
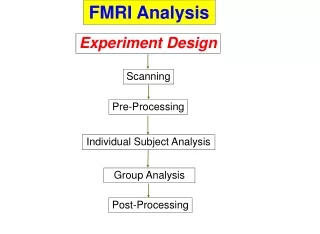
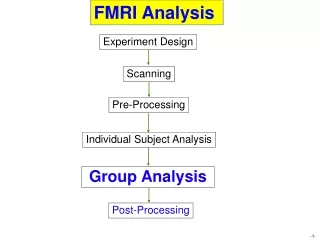
Group Analysis. File: GroupAna.pdf. Gang Chen SSCC/NIMH/NIH/HHS. Overview Why do we need to do group analysis? Summarizing results from multiple subjects Various group analysis approaches t -tests: uber_ttest.py /3dttest + +/3dttest , 3dMEMA ANOVA-style: 3dANOVA/2/3 , GroupAna

E N D
Group Analysis File: GroupAna.pdf Gang Chen SSCC/NIMH/NIH/HHS
Overview • Why do we need to do group analysis? • Summarizing results from multiple subjects • Various group analysis approaches • t-tests: uber_ttest.py/3dttest++/3dttest, 3dMEMA • ANOVA-style: 3dANOVA/2/3, GroupAna • Advanced approaches: 3dLME • Covariate modeling and complications • One group: uber_ttest.py/3dttest++, 3dMEMA, 3dLME • Two or more groups: : 3dttest++, 3dMEMA, 3dLME • Nonparametric approach • Fixed-effects analysis • Miscellaneous
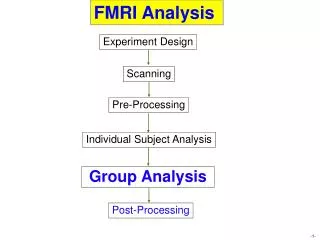
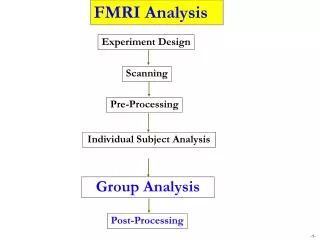
Summary: Individual Subject Analysis • Basics of linear model • FMRI experiment types • Block design; Event related experiment; Mixed • FMRI data decomposition: three components • Baseline + slow drift + effects of no interest; Effects of interest; Unknown • Effects of interest: understanding BOLD vs. stimulus: IRF • Modeling with fixed-shape IRF: GAM(p,q), BLOCK(d,p) • Modeling with no assumption re: IRF (model free or data driven) • TENT(b,c,n), CSPLIN(b,c,n) • Modeling with one major IRF plus shape adjustment • SPMG1/2/3 • Other issues • Multicollinearity • Catenation • Percent signal change
Why Group Analysis? • Summarizing individual subject results • Why not one analysis with a mega model for all subjects? • Computationally unmanageable • Heterogeneity in data or experiment design across subjects • What is a valid summarizing method? • Effect of subject i = group effect + deviation of subject i • A simple (one-sample t-test) model βi = b + εi, εi ~ N(0, σ2) • If individual effects are consistent across most or all subjects, the deviations would be relatively small • How small do we consider deviations comfortable? • Cross-subject variability measure: standard error • Significance measure = group effect relative to variability • Student t-test
Terminology: Fixed factor/effect - discrete variable • Treated as a fixed variable (constant) in the model • Categorization of conditions/tasks (modality: visual/auditory) • Within-subject (repeated-measures) factor • Subject-grouping: Group of subjects (gender, normal/patients) • Between-subject factor • All levels of a factor are of interest (house vs. face) • main effect, contrasts among levels • Fixed in the sense of statistical inferences • apply only to the specific levels of the factor • don’t extend to other potential levels that might have been included • Fixed effects may also include continuous variables (covariates) • Of direct interest • Improving statistical power by controlling for data variability
Terminology: Random factor/effect • Random variable in the model: exclusively subject in FMRI • average + effects uniquely attributable to each subject: e.g. N(μ, τ2) • Requires enough number of subjects • Each individual subject effect is of NO interest • Random in the sense • subjects serve as a random sample (representation) from a population • inferences can be generalized to a hypothetical population • Fixed vs. random effects • Conventional model βi = b + εi, εi ~ N(0, σ2) • Linear mixed-effects model βi = b + δi + εi, δi ~ N(0, τ2), εi ~ N(0, σ2) • b: universal constant • δi: each subject’s unique and consistent personality • εi: random fluctuations in life
Terminology: Covariate • Historically a continuous variable: extension from t-test and ANOVAs • Factor (categorical) vs. covariate (continuous) • Examples: age, IQ, brain volume, personality measures, etc. • Modeling perspective • Some people use it as effect of no interest • Effect of interest vs. effect of no interest • Could be discrete (gender, scanner, handedness) or continuous • User perspective • First usage adopted here • Clarity, modeling consideration (more later) • In the end of the day it’s the same model • A few caveats
Models at Group Level • Conventional approach: taking (or linear combination of multiple ‘s) only for group analysis • Assumption: all subjects have same precision (reliability, standard error, confidence interval) about • All subjects are treated equally • Student t-test: paired, one- and two-sample; ANOVA-style; LME • Alternative: taking both (or linear combination of multiple ‘s) and t-statistic • t-statistic contains precision information about • Each subject is weighted based on precision • Chen et al., FMRI Group Analysis Combining Effect Estimates and Their Variances. NeuroImage. 10.1016/j.neuroimage.2011.12.060 • All models are some sorts of linear model • t-test, ANOVA, LME, MEMA • Partition each subject’s effect into multiple components
One-Sample Case • One group of subjects (n ≥ 10) • One condition (visual or auditory) effect • Linear combination of effects (visual - auditory) • Null hypothesis H0: average effect = 0 • Rejecting H0 is of interest! • Results • Average effect at group level • Looks like nobody really cares about it • Significance: t-statistic • Two-tailed by default (one-tailed: divide the sliderbar p by 2) • Approaches • uber_ttest.py, 3dttest++ (3dttest), 3dMEMA
One-Sample Case: Example • 3dttest++: taking only for group analysis 3dttest++ –prefix VisGroup \ -mask mask+tlrc \ -setA 'OLSQ.FP.b+tlrc[Vrel#0_Coef]’ \ 'OLSQ.FR.b+tlrc[Vrel#0_Coef]’ \ …… 'OLSQ.GM.b+tlrc[Vrel#0_Coef]’ \ • 3dMEMA: taking and t-statistic for group analysis 3dMEMA –prefix VisGroupMEMA \ -mask mask+tlrc \ -setA Vis \ FP 'REML.FP.b+tlrc[Vrel#0_Coef]’ 'REML.FP.b+tlrc[Vrel#0_Tstat]’ \ FR 'REML.FR.b+tlrc[Vrel#0_Coef]’ 'REML.FR.b+tlrc[Vrel#0_Tstat]’ \ …… GM 'REML.GM.b+tlrc[Vrel#0_Coef]’ 'REML.GM.b+tlrc[Vrel#0_Tstat]’ \ -missing_data 0
Two-Sample Case • Two groups of subjects (n ≥ 10) • One condition (visual or auditory) effect • Linear combination of multiple effects (visual - auditory) • Example: Gender difference in emotion effect? • Null hypothesis H0: Group1 = Group2 • Results • Group difference in average effect • Significance: t-statistic - Two-tailed by default • Approaches • uber_ttest.py, 3dttest++ (3dttest), 3dMEMA • One-way between-subjects ANOVA • 3dANOVA: can also obtain individual group test
Paired Case • One groups of subjects (n ≥ 10) • Two conditions (visual or auditory): no missing data allowed • Example: House vs. Face; Visual vs. Auditory • Null hypothesis H0: Condition1 = Condition2 • Results • Average effect at group level • Significance: t-statistic (Two-tailed by default) • Approaches • uber_ttest.py, 3dttest++ (3dttest), 3dMEMA • One-way within-subject (repeated-meaures) ANOVA • 3dANOVA2 –type 3: can also obtain individual condition test • Essentially equivalent to one-sample case • Use contrast instead of individual effects as input
Paired Case: Example • 3dttest++: comparing two conditions 3dttest++ –prefix Vis_Aud \ -mask mask+tlrc -paired \ -setA 'OLSQ.FP.b+tlrc[Vrel#0_Coef]’ \ 'OLSQ.FR.b+tlrc[Vrel#0_Coef]’ \ …… 'OLSQ.GM.b+tlrc[Vrel#0_Coef]’ \ -setB 'OLSQ.FP.b+tlrc[Arel#0_Coef]’ \ 'OLSQ.FR.b+tlrc[Arel#0_Coef]’ \ …… 'OLSQ.GM.b+tlrc[Arel#0_Coef]’ \
Paired Case: Example • 3dMEMA: comparing two conditions 3dMEMA –prefix Vis_Aud_MEMA \ -mask mask+tlrc \ -setA Vis \ FP 'REML.FP.b+tlrc[Vrel#0_Coef]’ 'REML.FP.b+tlrc[Vrel#0_Tstat]’ \ FR 'REML.FR.b+tlrc[Vrel#0_Coef]’ 'REML.FR.b+tlrc[Vrel#0_Tstat]’ \ …… GM 'REML.GM.b+tlrc[Vrel#0_Coef]’ 'REML.GM.b+tlrc[Vrel#0_Tstat]’ \ -setB Aud \ FP 'REML.FP.b+tlrc[Arel#0_Coef]’ 'REML.FP.b+tlrc[Arel#0_Tstat]’ \ FR 'REML.FR.b+tlrc[Arel#0_Coef]’ 'REML.FR.b+tlrc[Arel#0_Tstat]’ \ …… GM 'REML.GM.b+tlrc[Arel#0_Coef]’ 'REML.GM.b+tlrc[Arel#0_Tstat]’ \ -missing_data 0
One-Way Between-Subjects ANOVA • Two or more groups of subjects (n ≥ 10) • One condition or linear combination of multiple conditions • Example: House, face, or house vs. face • Null hypothesis H0: Group1 = Group2 • Results • Average group difference • Significance: t- and F-statistic (two-tailed by default) • Approaches • 3dANOVA • With more than two groups, can break into pairwise group comparisons with 3dttest++ (3dttest), 3dMEMA
Multiple-Way Between-Subjects ANOVA • Two or more subject-grouping factors: factorial • One condition or linear combination of multiple conditions • Example: gender, control/patient, genotype, handedness, … • Testing main effects, interactions, single group, group comparisons • Significance: t- (two-tailed by default) and F-statistic • Approaches • Factorial design (imbalance not allowed): two-way (3dANOVA2 –type 1), three-way (3dANOVA3 –type 1) • Up to four-way ANOVA: GroupAna (imbalance allowed) • All factors have two levels: uber_ttest.py, 3dttest++ (3dttest), 3dMEMA • Using group coding with 3dttest++ (3dttest), 3dMEMA: imbalance allowed
One-Way Within-Subject ANOVA • Also called one-way repeated-measures: one group of subject (n ≥ 10) • Two or more conditions • Example: happy, sad, neutral • Main effect, simple effects, contrasts and general linear tests • Significance: t- (two-tailed by default) and F-statistic • Approaches • 3dANOVA2 -type 3 (two-way ANOVA with one random factor) • With two conditions, equivalent to paired case with 3dttest++ (3dttest), 3dMEMA • With more than two conditions, can break into pairwise comparisons with 3dttest++ (3dttest), 3dMEMA
One-Way Within-Subject ANOVA • Example: visual vs. auditory condition 3dANOVA2 –type 3 -alevels 2 -blevels 10 \ -prefix Vis_Aud -mask mask+tlrc \ -dset 1 1 'OLSQ.FP.b+tlrc[Vrel#0_Coef]’ \ -dset 1 2 'OLSQ.FR.b+tlrc[Vrel#0_Coef]’ \ …… -dset 1 10 'OLSQ.GM.b+tlrc[Vrel#0_Coef]’ \ -dset 2 1 'OLSQ.FP.b+tlrc[Arel#0_Coef]’ \ -dset 2 2 'OLSQ.FR.b+tlrc[Arel#0_Coef]’ \ …… -dset 2 10 'OLSQ.GM.b+tlrc[Arel#0_Coef]’ \ -amean 1 V \ -amean 2 A \ -adiff 1 2 VvsA \ -fa FullEffect \ -bucket anova.VA
Two-Way Within-Subject ANOVA • Factorial design; also known as two-way repeated-measures • Two within-subject factors • Example: emotion and category (visual/auditory) • Testing main effects, interactions, simple effects, contrasts • Significance: t- (two-tailed by default) and F-statistic • Approaches • 3dANOVA3 –type 4 (three-way ANOVA with one random factor) • All factors have two levels: uber_ttest.py, 3dttest++ (3dttest), 3dMEMA • Missing data? • Break into t-tests: uber_ttest.py, 3dttest++ (3dttest), 3dMEMA • 3dLME (work in progress)
Two-Way Mixed ANOVA • Factorial design • One between-subjects and one within-subject factor • Example: gender (male and female) and emotion (happy, sad, neutral) • Testing main effects, interactions, simple effects, contrasts • Significance: t- (two-tailed by default) and F-statistic • Approaches • 3dANOVA4 –type 5 (three-way ANOVA with one random factor) • If all factors have two levels, can run 3dttest++ (3dttest), 3dMEMA • Missing data? • Unequal number of subjects across groups: GroupAna • Break into t-test: uber_ttest.py, 3dttest++ (3dttest), 3dMEMA • 3dLME (work in progress)
Group analysis with multiple basis functions • Basis functions: TENT, CSPLIN • Area under the curve (AUC) approach • Forget about the subtle shape difference • Focus on the response magnitude measured by AUC • Issues: Shape information lost; Undershoot may cause trouble • Maintaining shape information • Null hypothesis H0: β1=β2=…=βk=0 (NOTβ1=β2=…=βk) • 3dLME: can only handle simple cases, not sohisticated ANOVA • Result: F-statistic for H0 and t-statistic for each basis function • Limitation: only works for simple cases and is difficult to handle ANOVA-style analysis • Basis functions of SPMG2/3: Only take SPMG1 to group
A few cases where 3dLME shines • Maintaining shape information with TENT/CSPLIN • Multiple effect estimates (runs/sessions) per conditions • Number of effect estimates may vary across conditions and subjects • Covariate modeling at the presence of within-subject (or repeated-measures) variable • Subject-specific random effect in covariate modeling • Missing data in longitudinal studies • Missing at random (MAR) • Group studies involving family members or twins • Subjects are genetically related within each family • Specify variance-covariance structure for genetic relatedness
If your case hasn’t been covered so far • GroupAna (up to four-way ANOVA) • If all factors have two levels, run 3dttest++ (3dttest), 3dMEMA • Try to break into multiple t-tests: uber_ttest.py, 3dttest++ (3dttest), 3dMEMA • 3dLME (work in progress) • Still can’t find a solution? • Blame YOURSELF! Should have thought of the situation in experiment design • Let me know
Covariates • Confusing usage in literature • May or may not be of direct interest • Direct interest: relation between response and the covariate • Is response proportional to response time? • Of no interest: confounding, nuisance, or interacting variables • Controlling for or covarying or partialling out: what does it mean? • Subtle issue in this case: centering • Continuous or discrete • Continuous: historically originated from ANCOVA • I solely use it as a continuous variable to avoid confusion • Very careful when treating a discrete (categorical) variable as covariate • Dummy coding • Interaction
Covariate: Modeling framework • Most people learned covariate modeling with ANCOVA • Historical extension to ANOVA • Quite limited and not flexible • Not a good approach in general • GLM or LME: broader context • All explanatory variables are treated equally in the model • Doesn’t matter: variable of interest or not, discrete or continuous • Discrimination or categorization occurs only at human (not model) level
What variables can serve as covariate? • Considerations • Subject-level (vs. trial-level: handled via amplitude modulation) • Usually one value per subject, but maybe more than one with within-subject factor • Tons of potential candidates: Overfitting • Prior information • Outlier information from 3dMEMA • Examples • Age, IQ, brain volume, cortex thickness • Behavioral data: reaction time • Amplitude modulation deals with cross-trial variability at individual level • Covariate modeling at group level handles variability across subjects
Handling covariates: one group • Model yi = α0+α1xi+ i, for ith subject: no other variables • α1 - slope (change rate, marginal effect): effect per unit of x • Simple and straightforward: no manipulation needed • α0 – intercept (x=0): group effect while controlling x • Controlling is NOT good enough • Interpretability -α0 at what x value: mean or any other value? • Centering is crucial for interpretability • Center does not have to be mean
Covariates: two or more groups • Slope • Same or different across groups? • Usually we don’t know in advance • Start with different slopes – interaction between group and covariate • If same, then model tuning • Intercept: centering again • Same or different center across groups? • How to decide? Plot out covariate distribution • If about the same, nice and easy! • If dramatically different, now what? • If possible, this issue should have been though of when designing the experiment • You may balance covariate values (e.g. age) across groups • How about if it is not under your control (e.g., response time)?
Covariates: different center across groups • Most statisticians (including in FMRI) consider it horrible • For example, Miller GM and Chapman JP. 'Misunderstanding analysis of covariance', J Abnormal Psych 110: 40-48 (2001) • SPM and FSL communities • It may well be the case • Groups were not balanced in experiment design: design failure! • E.g., males and females have different age distribution, and we can’t resolve: in the end the group difference is due to sex or age difference? • But I beg to differ under other scenarios • Now stop and think! • What is the point of considering the covariate? Using RT as example, we can account for within-group variability of RT, not variability across all subjects in both groups • Strategy: Centering differently across groups! • Do NOT center around a common point: overall mean, for exampl • Age: adolescents vs. seniors: what would it happen when centering around
Treating Categorical Variable as Covariate • Popular coding methods • Dummy coding: 0s and 1s with a reference (or base) level (group) • Convenient for group difference • Cell mean coding: 0s and 1s without intercept • Good for individual group effect • Effect (or deviation) coding: 1, 0, and -1 with a reference (or base) level (group) • Nice for main effect across groups
Caveats: Categorical Variable as Covariate • Most people simply add a categorical variable in the model as an additive explanatory variable • For example, male/female, scanners, … • Most people don’t even look into group difference, but it might be of scientific interest in the first place; even if not so, such difference warrants discussion instead of sweeping under the carpet • Centering? Depending on specific coding strategy! Effect coding is preferable with two groups, and centering is not needed especially the 2 groups have unequal number of subjects • With other variables present, it could be problematic without considering interactions between grouping and other variables • Coding is usually done internally in 3dttest++/3dMEMA • Option available for interaction • With > 1 grouping variable, coding may be needed
Covariate Modeling: Sophisticated Cases • With presence of within-subject factor • Most statisticians think (including in FMRI) should NOT be done: cross-level difference may be correlated with the covariate, thus invalidating the purpose of incorporating the covariate • I tend to disagree again: same as cross-group scenario • Check covariate distribution across levels • Similar mean: overall centering • Different mean: disparate centering allows for accounting for within-level variability • Program: 3dLME (work in progress) • Cross-subject adjustment in covariate modeling • Each subject may have different slope • Program: 3dLME
Group Analysis: Non-Parametric Approach • Parametric approach • Enough number of subjects> n 10 • Random effects of subjects: usually Gaussian distribution • Individual and group analyses: separate • Non-parametric approach • Moderate number of subjects: 4 < n < 10 • No assumption of data distribution (e.g., normality) • Statistics based on ranking or permutation • Individual and group analyses: separate
Group Analysis: Fixed-Effects Analysis • When to consider? • Group level: a few subjects: n < 6 • Individual level: combining multiple runs/sessions • Case study: difficult to generalize to whole population • Model βi = b+εi, εi ~ N(0, σi2), σi2: within-subject variability • Fixed in the sense that cross-subject variability is not considered • Direct fixed-effects analysis (3dDeconvolve/3dREMLfit) • Combine data from all subjects and then run regression • Fixed-effects meta-analysis (3dcalc) : weighted least squares • β = ∑wiβi/∑wi, wi = ti/βi = weight for ith subject • t = β√∑wi
Non-Parametric Analysis • Programs: roughly equivalent to permutation tests • 3dWilcoxon (~ paired t-test) • 3dFriedman(~ one-way within-subject with 3dANOVA2) • 3dMannWhitney(~ two-sample t-test) • 3dKruskalWallis(~ between-subjects with 3dANOVA) • Pros: Less sensitive to outliers (more robust) • Cons • Multiple testing correction limited to FDR (3dFDR) • Less flexible than parametric tests • Can’t handle complicated designs with more than one fixed-effects factor • Can’t handle covariates
Miscellaneous • Missing data: missing at random (MAR) • Remove subjects from analysis • Can’t afford to exclude subjects: 3dLME • Voxelwise covariate: 3dttest++ • Compare to a constant • Null hypothesis H0: response = 1%; 3dttest -base1 bval • Compare to a voxelwise constant (e.g., one patient) • 3dttest -base1_dset DSET • Correlation between two sets of 3D data: two conditions, one correlates with the other? • 3ddot –demean • 3dttest++: 3dMean -> mean, 3dMean –sd -> SD, and then 3dcalc to standardize • Post hoc ROI analysis • May not be consistent with voxelwise results
Group Analysis Program List • 3dttest++(one-sample, two-sample and paired t) + covariates (voxel-wise) • 3dttest is almost obsolete except for two special cases • 3dMEMA(R package for mixed-effects analysis, t-tests plus covariates) • 3dttest(mostly obsolete: one-sample, two-sample and paired t) • 3ddot(correlation between two sets) • 3dANOVA (one-way between-subject) • 3dANOVA2 (one-way within-subject, 2-way between-subjects) • 3dANOVA3 (2-way within-subject and mixed, 3-way between-subjects) • 3dRegAna(obsolete: regression/correlation, covariates) • GroupAna(Matlab package for up to 5-way ANOVA) • 3dLME(R package for various kinds of group analysis)
Two perspectives: batch vs. piecemeal • ANOVA: factors/levels, balancedness • Main effects, interactions, simple effects, contrasts, … • Syntactic sugarfor a special subgroup of LME • Almost everybody trained in the conventional paradigm • Institutionalized; stuck in a rut • Pros: get almost everything you want in one batch model • Cons: F-stat for main effect or interaction is difficult to comprehend sometimes: a condensed/summarized test with vague information when levels/factors greater than 2 (I don’t like F-test personally!!! Sorry, Ronald A. Fisher…), and with assumptions: homogeneity with multiple groups, and compound symmetry when a within-subject factor has more than 2 levels • Tests of interest • Simple/straightforward/piecemeal: focus on each test & handle one at a time • Mainly t-stat: one-sample, paired, two-sample • All main effects and interactions can be teased apart into multiple t-tests • No stringent assumptions such as compound symmetry
Teasing apart F-statistic • F for the main effect of a factor with two levels is essentially t • F carries less information than t: directionality • F for interactions of all factors with two levels are essentially t • F-test for interaction between A and B: equivalent to t-test for (A1B1-A1B2)-(A2B1-A2B2) or (A1B1-A2B1)-(A1B2-A2B2), but t is better than F: a positive t shows A1B1-A1B2 > A2B1-A2B2 and A1B1-A2B1 > A1B2-A2B2 • Again F carries less information than t: directionality • With > 2 levels, F-statistic corresponds to multiple t-tests • F not significant, but some individual t-tests significant; or the other way around
Summary • Why do we need to do group analysis? • Summarizing results from multiple subjects • Various group analysis approaches • t-tests: uber_ttest.py/3dttest++/3dttest, 3dMEMA • ANOVA-style: 3dANOVA/2/3, GroupAna • Advanced approaches: 3dLME • Covariate modeling and complications • One group: uber_ttest.py/3dttest++, 3dMEMA, 3dLME • Two or more groups: : 3dttest++, 3dMEMA, 3dLME • Nonparametric approach • Fixed-effects analysis • Miscellaneous