Download
1 / 88
1.4k likes | 2.75k Views
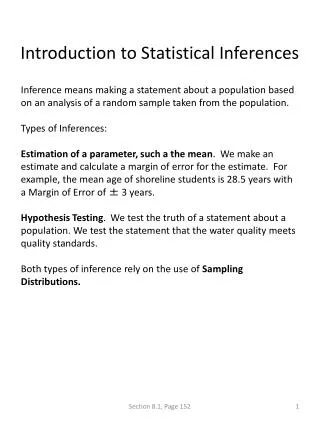
Introduction to choosing the correct statistical test. + Tests for Continuous Outcomes I. Questions to ask yourself:. What is the outcome (dependent) variable? Is the outcome variable continuous, binary/categorical, or time-to-event? What is the unit of observation? person* (most common)

E N D
Introduction to choosing the correct statistical test + Tests for Continuous Outcomes I
Questions to ask yourself: • What is the outcome (dependent) variable? • Is the outcome variable continuous, binary/categorical, or time-to-event? • What is the unit of observation? • person* (most common) • lesion • half a face • physician • clinical center • Are the observations independent or correlated? • Independent: observations are unrelated (usually different, unrelated people) • Correlated: some observations are related to one another, for example: the same person over time (repeated measures), lesions within a person, half a face, hands within a person, controls who have each been selected to a particular case, sibling pairs, husband-wife pairs, mother-infant pairs
Correlated data example • Split-face trial: • Researchers assigned 56 subjects to apply SPF 85 sunscreen to one side of their faces and SPF 50 to the other prior to engaging in 5 hours of outdoor sports during mid-day. • Sides of the face were randomly assigned; subjects were blinded to SPF strength. • Outcome: sunburn Russak JE et al. JAAD 2010; 62: 348-349.
Results: Table I -- Dermatologist grading of sunburn after an average of 5 hours of skiing/snowboarding (P = .03; Fisher’s exact test) Fisher’s exact test compares the following proportions: 1/56 versus 8/56. Note that individuals are being counted twice!
Correct analysis of data… Table 1. Correct presentation of the data from: Russak JE et al. JAAD 2010; 62: 348-349. (P = .016; McNemar’s test). McNemar’s test evaluates the probability of the following: In all 7 out of 7 cases where the sides of the face were discordant (i.e., one side burnt and the other side did not), the SPF 50 side sustained the burn.
Example: two-sample t-test • In 1980, some researchers reported that “men have more mathematical ability than women” as evidenced by the 1979 SAT’s, where a sample of 30 random male adolescents had a mean score ± 1 standard deviation of 436±77 and 30 random female adolescents scored lower: 416±81 (genders were similar in educational backgrounds, socio-economic status, and age). Do you agree with the authors’ conclusions?
Two sample ttest Statistical question: Is there a difference in SAT math scores between men and women? • What is the outcome variable? Math SAT scores • What type of variable is it? Continuous • Is it normally distributed? Yes • Are the observations correlated? No • Are groups being compared, and if so, how many? Yes, two two-sample ttest
Two-sample t-test 1. Define your hypotheses (null, alternative) H0: ♂-♀ math SAT = 0 Ha: ♂-♀ math SAT ≠ 0 [two-sided]
Two-sample t-test 2. Specify your null distribution: F and M have approximately equal standard deviations/variances, so make a “pooled” estimate of standard deviation/variance: The standard error of a difference of two means is: Differences in means follow a T-distribution…
T distribution • A t-distribution is like a Z distribution, except has slightly fatter tails to reflect the uncertainty added by estimating the standard deviation. • The bigger the sample size (i.e., the bigger the sample size used to estimate ), then the closer t becomes to Z. • If n>100, t approaches Z.
Student’s t Distribution Note: t Z as n increases Standard Normal (t with df = ) t (df = 13) t-distributions are bell-shaped and symmetric, but have ‘fatter’ tails than the normal t (df = 5) t 0 from “Statistics for Managers” Using Microsoft® Excel 4th Edition, Prentice-Hall 2004
Student’s t Table Upper Tail Area Let: n = 3 df = n - 1 = 2 = .10/2 =.05 df .25 .10 .05 1 1.000 3.078 6.314 0.817 1.886 2 2.920 /2 = .05 3 0.765 1.638 2.353 The body of the table contains t values, not probabilities 0 t 2.920 from “Statistics for Managers” Using Microsoft® Excel 4th Edition, Prentice-Hall 2004
t distribution values With comparison to the Z value Confidence t t t Z Level (10 d.f.)(20 d.f.)(30 d.f.) ____ .80 1.372 1.325 1.310 1.28 .90 1.812 1.725 1.697 1.64 .95 2.228 2.086 2.042 1.96 .99 3.169 2.845 2.750 2.58 Note: t Z as n increases from “Statistics for Managers” Using Microsoft® Excel 4th Edition, Prentice-Hall 2004
Two-sample t-test 2. Specify your null distribution: F and M have approximately equal standard deviations/variances, so make a “pooled” estimate of standard deviation/variance: The standard error of a difference of two means is: Differences in means follow a T-distribution; here we have a T-distribution with 58 degrees of freedom (60 observations – 2 means)…
Two-sample t-test 3. Observed difference in our experiment = 20 points
Two-sample t-test 4. Calculate the p-value of what you observed Critical value for two-tailed p-value of .05 for T58=2.000 0.98<2.000, so p>.05 5. Do not reject null! No evidence that men are better in math ;)
Corresponding confidence interval… Note that the 95% confidence interval crosses 0 (the null value).
Review Question 1 A t-distribution: • Is approximately a normal distribution if n>100. • Can be used interchangeably with a normal distribution as long as the sample size is large enough. • Reflects the uncertainty introduced when using the sample, rather than population, standard deviation. • All of the above.
Review Question 1 A t-distribution: • Is approximately a normal distribution if n>100. • Can be used interchangeably with a normal distribution as long as the sample size is large enough. • Reflects the uncertainty introduced when using the sample, rather than population, standard deviation. • All of the above.
Review Question 2 In a medical student class, the 6 people born on odd days had heights of 64.64 inches; the 10 people born on even days had heights of 71.15 inches. Height is roughly normally distributed. Which of the following best represents the correct statistical test for these data? a. b. c. d.
Review Question 2 In a medical student class, the 6 people born on odd days had heights of 64.64 inches; the 10 people born on even days had heights of 71.15 inches. Height is roughly normally distributed. Which of the following best represents the correct statistical test for these data? a. b. c. d.
Example: paired ttest TABLE 1. Difference between Means of "Before" and "After" Botulinum ToxinA Treatment
Paired ttest Statistical question: Is there a difference in date success after BoTox? • What is the outcome variable? Date success • What type of variable is it? Continuous • Is it normally distributed? Yes • Are the observations correlated? Yes, it’s the same patients before and after • How many time points are being compared? Two paired ttest
Paired ttest mechanics • Calculate the change in date success score for each person. • Calculate the average change in date success for the sample. (=.13) • Calculate the standard error of the change in date success. (=.05) • Calculate a T-statistic by dividing the mean change by the standard error (T=.13/.05=2.6). • Look up the corresponding p-values. (T=2.6 corresponds to p=.014). • Significant p-values indicate that the average change is significantly different than 0.
Patient BP Before (diastolic) BP After 1 100 92 2 89 84 3 83 80 4 98 93 5 108 98 6 95 90 Paired ttest example 2…
Patient Diastolic BP Before D. BP After Change 1 100 92 -8 2 89 84 -5 3 83 80 -3 4 98 93 -5 5 108 98 -10 6 95 90 -5 Example problem: paired ttest Null Hypothesis: Average Change = 0
Change -8 -5 -3 -5 Null Hypothesis: Average Change = 0 -10 -5 Example problem: paired ttest With 5 df, T>2.571 corresponds to p<.05 (two-sided test)
Change -8 -5 -3 -5 -10 -5 Example problem: paired ttest Note: does not include 0.
Using our class data… • Hypothesis: Students who consider themselves street smart drink more alcohol than students who consider themselves book smart. • Null hypothesis: no difference in alcohol drinking between street smart and book smart students.
Wilcoxon sum-rank test Statistical question: Is there a difference in alcohol drinking between street smart and book smart students? • What is the outcome variable? Weekly alcohol intake (drinks/week) • What type of variable is it? Continuous • Is it normally distributed? No (and small n) • Are the observations correlated? No • Are groups being compared, and if so, how many? two Wilcoxon sum-rank test
Results: Book smart: Street smart: Mean=1.6 drinks/week; median = 1.5 Mean=2.7 drinks/week; median = 3.0
Wilcoxon rank-sum test mechanics… • Book smart values (n=13): 0 0 0 0 1 1 2 2 2 3 3 4 5 • Street Smart values (n=7): 0 0 2 3 3 5 6 • Combined groups (n=20): 0 0 0 0 0 0 1 1 2 2 2 2 3 3 3 3 4 5 5 6 • Corresponding ranks: 3.5* 3.5 3.5 3.5 3.5 3.5 7.5 7.5 10.5 10.5 10.5 10.5 14.5 14.5 14.5 14.5 17 18.5 18.5 20 *ties are assigned average ranks; e.g., there are 6 zero’s, so zero’s get the average of the ranks 1 through 6.
Wilcoxon rank-sum test… • Ranks, book smart: 3.5 3.5 3.5 3.5 7.5 7.5 10.5 10.5 10.5 14.5 14.5 17 18.5 • Ranks, street smart: 3.5 3.5 10.5 14.5 14.5 18.5 20 • Sum of ranks book smart: 3.5+3.5+3.5+3.5+7.5+7.5+10.5+10.5+10.5+ 14.5+14.5+17+18.5= 125 • Sum of ranks street smart: 3.5+3.5+10.5+14.5 +14.5+18.5+20= 85 • Wilcoxon sum-rank test compares these numbers accounting for the differences in sample size in the two groups. • Resulting p-value (from computer) = 0.24 • Not significantly different!
Example 2, Wilcoxon sum-rank test… 10 dieters following Atkin’s diet vs. 10 dieters following Jenny Craig Hypothetical RESULTS: Atkin’s group loses an average of 34.5 lbs. J. Craig group loses an average of 18.5 lbs. Conclusion: Atkin’s is better?
Example: non-parametric tests BUT, take a closer look at the individual data… Atkin’s, change in weight (lbs): +4, +3, 0, -3, -4, -5, -11, -14, -15, -300 J. Craig, change in weight (lbs) -8, -10, -12, -16, -18, -20, -21, -24, -26, -30
Jenny Craig 30 25 20 P e r c 15 e n t 10 5 0 -30 -25 -20 -15 -10 -5 0 5 10 15 20 Weight Change
Atkin’s 30 25 20 P e r c 15 e n t 10 5 0 -300 -280 -260 -240 -220 -200 -180 -160 -140 -120 -100 -80 -60 -40 -20 0 20 Weight Change
Wilcoxon Rank-Sum test • RANK the values, 1 being the least weight loss and 20 being the most weight loss. • Atkin’s • +4, +3, 0, -3, -4, -5, -11, -14, -15, -300 • 1, 2, 3, 4, 5, 6, 9, 11, 12, 20 • J. Craig • -8, -10, -12, -16, -18, -20, -21, -24, -26, -30 • 7, 8, 10, 13, 14, 15, 16, 17, 18, 19
Wilcoxon Rank-Sum test • Sum of Atkin’s ranks: • 1+ 2 + 3 + 4 + 5 + 6 + 9 + 11+ 12 + 20=73 • Sum of Jenny Craig’s ranks: 7 + 8 +10+ 13+ 14+ 15+16+ 17+ 18+19=137 • Jenny Craig clearly ranked higher! • P-value *(from computer) = .018
Review Question 3 When you want to compare mean blood pressure between two groups, you should: • Use a ttest • Use a nonparametric test • Use a ttest if blood pressure is normally distributed. • Use a two-sample proportions test. • Use a two-sample proportions test only if blood pressure is normally distributed.
Review Question 3 When you want to compare mean blood pressure between two groups, you should: • Use a ttest • Use a nonparametric test • Use a ttest if blood pressure is normally distributed. • Use a two-sample proportions test. • Use a two-sample proportions test only if blood pressure is normally distributed.