Download
1 / 26
260 likes | 404 Views
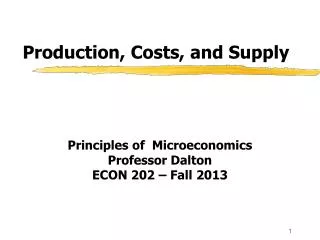
Section 2a Production and Costs. Overview. In this section we want to 1) Think about how production might occur and change as different amounts of inputs are used in the production process, and

E N D
Overview In this section we want to 1) Think about how production might occur and change as different amounts of inputs are used in the production process, and 2) Translate the production data into cost data. In other words, we will want to understand how the cost of producing various units of output might change as different amounts of inputs are used.
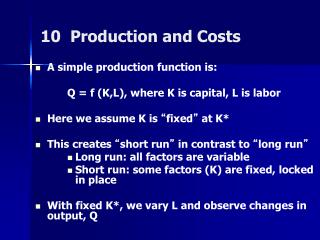
Fixed/variable inputs Inputs can be classified as either fixed or variable. A variable input is one that can be changed as the level of output is changed . A fixed input is one that can not be changed as the level of output is changed. We often think of labor as a variable input and capital or land as a fixed input.
Short run/long run The notion of a fixed or variable input is related to the time frame of production. The short run is that period of time when at least one input is fixed in amount. The long run is that period of time in which all inputs are variable. As an example of this consider fast food in Wayne. About any store in town could remodel and increase floor space in about 3 months. So after 3 months we have the long run, all inputs can vary - even floor space. But less than three months is the short run because there is only so much floor space to use.
example to illustrate some ideas Quantity Total product Marginal product of labor or output of labor 1 3 3 2 7 4 3 12 5 4 16 4 5 19 3 6 21 2 7 22 1 Note in the example that the amount of capital is behind the scene here and is fixed in amount. Labor is variable.
example continued In the example, the relationship between the labor used and the total product (TP) is called the short run production function. The marginal product of labor is the additional output forthcoming from the additional unit of labor. Note the first unit of labor has a marginal product of 3. Note that as the units of labor increases the marginal product first increases, but then begins to diminish after the third unit of labor is employed.
example continued The marginal product curve has the pattern it does because of the way the fixed input is used. Remember that the variable input is used in conjunction with only so much of the fixed input. In the beginning, as more labor is added, specialization of labor can occur and increasing returns to labor can result, but eventually as more labor is added there will be less of the fixed input to work with and thus additions to output have to diminish. The way output changes as the variable input is changed, with a given amount of a fixed input, is summarized with the phrase diminishing marginal product.
graphs have different scales graphs of TP and MP TP MP 5 12 3 labor labor 3 Note at low units of labor used, more labor increases output more than previous units were able to, but eventually additions to output begin to slow down - the marginal product begins to diminish. The height of each curve at an amount of labor is the value of that variable.
short run costs In the short run we will consider the fixed and variable costs of production and how they change as more of the variable input is used. Definitions: Total cost (TC) = Total variable cost(TVC) + Total fixed cost (TFC). Marginal cost(MC) = (change in TC)/(change in output). where change in output = 1 when possible. Average cost (AC) = TC/Q. Average variable cost(AVC) = TVC/Q. Average fixed cost(AFC) = TFC/Q. Note that in the short run fixed costs must be paid whether output is zero or 100,000 units.
example Let’s take the production example we had before and translate the production data into cost data. Say the cost of capital is $10 per hour and the cost of labor is $15 per hour. The next screen shows the continuation of our example.
example to illustrate some ideas Ql TP MP TFC TVC TC MC AFC AVC AC 0 0 - 10 0 10 - - - - 1 3 3 10 15 25 15/3 10/3 15/3 25/3 2 7 4 10 30 40 15/4 10/7 30/7 40/7 3 12 5 10 45 55 15/5 10/12 45/12 55/12 4 16 4 10 60 70 15/4 10/16 60/16 70/16 5 19 3 10 75 85 15/3 10/19 75/19 85/19 6 21 2 10 90 100 15/2 10/21 90/21 100/21 7 22 1 10 105 115 15/1 10/22 105/21 115/22
example to illustrate some ideas Ql TP MP TFC TVC TC MC AFC AVC AC 0 0 - 10 0 10 - - - - 1 3 3 10 15 25 5 3.33 5 8.33 2 7 4 10 30 40 3 12 5 10 45 55 4 16 4 10 60 70 5 19 3 10 75 85 6 21 2 10 90 100 7 22 1 10 105 115
graph of per unit costs in the short run $/unit AC AVC MC Q Note AVC and AC equal MC when AVC and AC are at their minimum values.
Cost concepts in a graph unit costs ATC1 MC $ ATC b AVC AVC1 a MC1 Q Q1
Interpretation • I have picked Q1 arbitrarily and have drawn a line from this Q up to the highest cost curve. • MC1 is the MC of the this unit. • AVC1 is the AVC of all the units. • ATC1 is the ATC of all the units.
Interpretation continued • Since TC = TFC + TVC, ATC = AFC + AVC or AFC = ATC - AVC. • So in the diagram, AFC1 = ATC1 - AVC1. • Area a = AVC1 times Q1 = TVC1. • Area b = (ATC1 - AVC1) times Q1 = TFC1. • Area a + b = TC
The long run • The long run is the time frame longer or just as long as it takes to alter the plant. • Thus the long run is that time period in which all inputs are variable.
Long Run • Another way to view the long run is to think about different short run situations and put them together. Think of a short run with one capital unit. Think of one with two capital units, and so on. • We would have a similar table of numbers and graphs as we did in the short run example when only one unit of capital was available.
Long Run continued • When we switch from one unit of capital to two units, we have the long run because all inputs are then variable. • But with the two units we would have short run curves for that level of capital. • Now we have two sets of cost curves, one for one unit of capital and one for two units of capital.
Long run continued • Thus the graph of the long run is really just a bunch of curves, one for each plant size. • I will draw two ATC curves, each with a different amount of capital used.
Long Run Graphs ATC ATC2 ATC1 Q Q1
Interpretation • If output is going to be less than Q1 in the long run then only one unit of capital would be wanted because those units would be produced cheapest with one unit of capital. • Greater than Q1 would be produced cheapest with two units of capital.
Interpretation • The long run curve is parts of the short run curves. For each range of output the long run curve is the segment of the short run curve that is the lowest, representing the cheapest way to produce that range of output in the long run. The final long run curve is smooth. Let’s see.
Smooth long run curve ATC Q
Reason for long run shape • The long run cost curve is said to be u - shaped, just as in the short run, but for a different reason. In the short run we had diminishing returns. In the long run we have economies of scale.
Reason continued • The basic idea of economies of scale is that at least for a while when the plant size is increased the average cost curve is pushed down, implying average costs are lowest in a bigger plant. It may be that further increases in plant size push the average cost curve back up. This would technically be called diseconomies of scale.