Download
1 / 22
220 likes | 340 Views
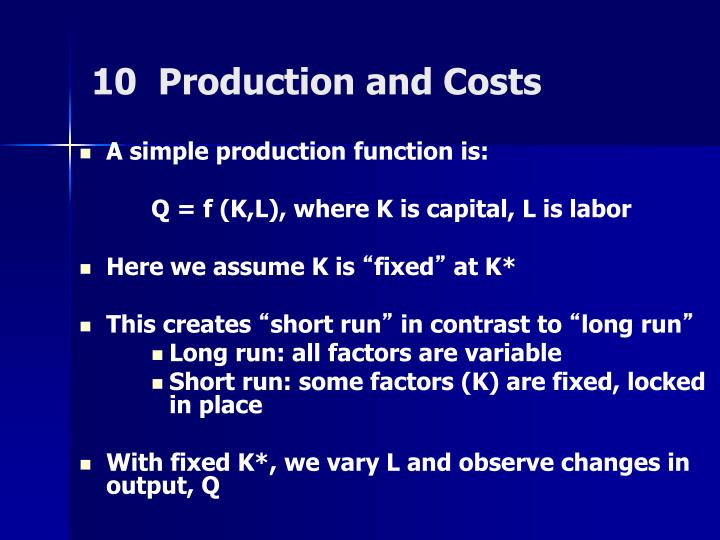
10 Production and Costs. A simple production function is: Q = f (K,L), where K is capital, L is labor Here we assume K is “ fixed ” at K* This creates “ short run ” in contrast to “ long run ” Long run: all factors are variable Short run: some factors (K) are fixed, locked in place

E N D
10 Production and Costs • A simple production function is: Q = f (K,L), where K is capital, L is labor • Here we assume K is “fixed” at K* • This creates “short run” in contrast to “long run” • Long run: all factors are variable • Short run: some factors (K) are fixed, locked in place • With fixed K*, we vary L and observe changes in output, Q
Some definitions • Total product: total output in a given time • Average product: total product (Q), divided by the amount of an input (L) used to produce it: • It is a ratio, such as Q/L • Marginal product: the change in output (Q) as the amount of an input (L) changes: • It is a derivative, such as dQ/dL • Diminishing marginal product: the decline in marginal product that takes place as use of an input rises (a fact of nature)
Let’s start a simple business:pizza production per hour in pizza shop (L) (Q) (dQ/dL = MPL) LaborersPizzasChange in pizzasAPL (Q/L) 0 0 - - 1 8 8 8 2 22 14 11 3 29 7 9.67 4 31 2 7.75 5 29 -2 5.8 6 20 -9 3.33 Note how labor productivity rises then falls in fixed production scale.
How many pizzas do you produce? (assume sale price is $3 each) New (L) (Q) (dQ/dL = MPL) LaborersPizzasChange in pizzasAPL (Q/L)TR = PxQ 0 0 - - 1 8 8 8 $24 2 22 14 11 $66 3 29 7 9.67 $87 4 31 2 7.75 $93 5 29 -2 5.8 $87 6 20 -9 3.33 $60 Where TR (total revenue) equals price times quantity sold.
Components of Costs • In the short run, some inputs (“capital” or K) are fixed—here, the size of the pizza shop is fixed. • Total cost has two components: • Fixed or unavoidable (“sunk”) costs • Variable or avoidable (“incremental”) costs • Accounting “costs” are only relevant when they can be avoided, i.e., when they are economic costs • Fixed costs cannot be avoided; thus, fixed costs are accounting notions only • Fixed costs do not affect production decisions in the short run
Costs • Total costs = Fixed costs + Variable costs • C = F + V • F is a constant, independent of output and unavoidable in the short run • V depends on inputs, and thus outputs: • V = (L * w) + (I * p) • Where w is the wage rate paid per unit of L • Where I are ingredients and p their price
Remember • “A sunk cost is an unrecoverable past expenditure. Such costs should seldom be taken into account when determining what to do in the future because, other than possible tax effects, they are irrelevant to what can be recovered.” • Charles Koch, CEO Koch Industries, p.33, “The Science of Success”
How many pizzas do you produce?Suppose ingredients cost per pizza $1. (L) (Q) LaborersPizzasTR = PxQ – Cost of pizza supplies 0 0 - 1 8 $24 - $8 = $16 2 22 $66 - $22 = $44 3 29 $87 - $29 = $58 4 31 $93 - $31 = $62 5 29 $87 - $29 = $58 6 20 $60 - $20 = $40 Pizza ingredients (tomato, etc.) are what kind of costs? What about labor?
How many pizzas do you produce?Suppose Labor is $6 per hour. (L) (Q) LaborersPizzasTR = PxQ – Cost – Labor = Net 0 0 - 1 8 $24 - $8 = $16 - $6 = $10 2 22 $66 - $22 = $44 - $12 = $32 3 29 $87 - $29 = $58 - $18 = $40 4 31 $93 - $31 = $62 - $24 = $38 5 29 $87 - $29 = $58 - $30 = $28 6 20 $60 - $20 = $40 - $36 = $4 But what about fixed costs (building, taxes, ovens)? Does that affect our decision?
How many pizzas do you produce?Suppose Labor is $20 per hour. (L) (Q) LaborersPizzasTR = PxQ – Cost – Labor = Net 0 0 - 1 8 $24 - $8 = $16 - $20 = $-4 2 22 $66 - $22 = $44 - $40 = $4 3 29 $87 - $29 = $58 - $60 = $-2 4 31 $93 - $31 = $62 - $80 = $-18 5 29 $87 - $29 = $58 - $100 = $-42 6 20 $60 - $20 = $40 - $120 = $-80 But what about fixed costs (building, etc.)?
Production and Costs: The Long Run • The long run • A period of time (or set of contracts) sufficient to permit all inputs to be variable; all costs are avoidable • There is no distinction between “types” of costs (fixed or variable); all costs are variable in the long run • Formally • C = (K*r) + (L*w) + (I*p) • Objective: choose a set of inputs (K,L,I) that minimizes total costs at each rate of output • Although the algebra is tedious, the basic geometry is quite simple
Cost Curves in the Long Run MC goes through minimum of ATC. Now ALL costs are variable. Is Q where we should produce? MC Average and Marginal Costs ATC Quantity Output Q
Economics of scaleThe behavior of average costs as output varies For Q < Q m, AC is falling: “Increasing returns to scale” For Q > Q m, AC is rising: “Decreasing returns to scale” At Q = Q m, AC is constant: “Constant returns to scale” Average and Marginal Costs MC ATC 0 Output (Q) Q m
Scale Economy Example • Study of hospitals in the U.S. found that per unit cost of providing hospital services was minimized at 250 beds. Hospitals with only 50 beds have costs 20-30% higher per bed service. • That is, AC drops and drops until Q is about 250 beds. Then is stable but begins to rise again eventually.
What Is Best Level of Output? If our output sells at price P* we will keep producing units (Q) so long as we cover the cost of producing added units. Difference between MC and ATC is profit for those units. Note that we do not operate at point of minimum cost. Price/ Costs MC ATC P* Profits per unit AC* 0 Output (Q) Q*
An Example: Making Olive Oil (short run) Marcello owns (or rents) the olive trees; he hires migrant workers at $4 per hour to pick olives and press oil. Labor Input (hours) Olive Oil Output (gallons) 100 30 200 100 300 200 400 350 500 800 600 1200 700 1400 800 1575 900 1700 1000 1800 11001850
Production and Cost of Olive Oil • Calculate total labor cost at various levels of output. • Calculate average cost per gallon. • Calculate marginal cost per gallon — since data are not gallon by gallon, calculate it based on the jumps from one level to the next. Then, draw the cost curves: total on one diagram, average and marginal on another.
Cost Measures [Output in gallons. Input in hours of labor.] Input Output TC __ AC MC 100 30 $ 400 $13.33 $13.33 200 100 800 8.00 5.71 300 200 1200 6.00 4.00 400 350 1600 4.57 2.67 500 800 2000 2.50 0.89 600 1200 2400 2.00 1.00 700 1400 2800 2.00 2.00 800 1575 3200 2.03 2.28 900 1700 3600 2.12 3.20 1000 1800 4000 2.22 4.00 11001850 4400 2.37 8.00 Draw the cost curves (approximately)
Cost curves Total, Average and Marginal Costs. Is point of lowest average cost where we should produce? $ Total Cost $/gallon MC AC $2 Output Lowest Average Cost Output Lowest Average Cost
Questions • Suppose the market price of olive oil is $2.30 per gallon. How much oil does Marcello produce to maximize profits? • Does he make a profit?
Answer Remember the Golden Rule MR = MC • Produce where MR ($2.30) equals MC. The golden rule! MR = MC That would be 1575 gallons, where MC is $2.28 per gallon. If he increased production to 1700 gallons by hiring another 100 hours of labor, his MC would rise to $3.20 for the additional gallons. 1575 gallons at $2.30 equals $3622 revenue minus cost of $3200 for a profit of $422. • But—is that really his profit?
Fixed Cost Question • In the 1920s there were British ships that burned coal for power. Not as efficient as newer oil burning ships. Their owners made enough money carrying cargo to pay variable costs—labor, fuel, etc.—but not enough revenue to cover all repayment costs (interest and principal) on the ships. • Was it foolish to continue to use the ships? • What should the banks do about the loans?