Download
1 / 98
1k likes | 1.54k Views
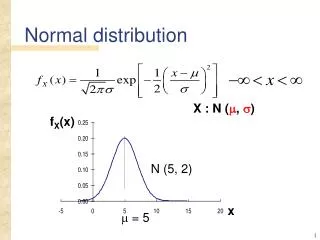
f X (x). x. = 5. Normal distribution. X : N ( , ). N ( 5, 2). Effect of varying parameters ( & ). f X (x). for C for B. B. C. A. x. Standard normal distribution. S: N (0,1). f X (x). x. a. Page 380 Table of Standard Normal Probability.

E N D
fX(x) x = 5 Normal distribution X : N (, ) N (5, 2)
Effect of varying parameters ( & ) fX(x) for C for B B C A x
Standard normal distribution S: N (0,1) fX(x) x
fX(x) x b a
Example: retaining wall Suppose X = N(200,30) x F
If the retaining wall is designed such that the reliability against sliding is 99%, How much friction should be provided? 2.33
Lognormal distribution fX(x) x Parameter l
Parameters for 0.3,
Probability for Log-normal distribution If a is xm, then is not needed.
P 3.19 Project completion time T a) Given information: T is normal = 30 = 7.81 P (T<40) = 0.9
P (T < 50) b) P ( T < 0 ) Yes Normal distribution ok?
c) If assume Log-normal distribution for T, with same value of m and s. = 7.81/30 = .26 • P (T<50)
P 3.20 Construction job that has a fleet of similar equipments In order to insure satisfactory operation, you require at least 90% equipments available.
Each equipment has a breakdown time T: time until break down Lognormal with mean 6 months, c.o.v. 25%
0) Suppose scheduled time period for maintenance is 5 months P (an equipment will break down before 5 months) = P (T<5) Expect 27% of equipment will not be operative ahead of the next scheduled maintenance.
- Suppose need at least 90% equipment available at any time a) - What should be the scheduled maintenance period to? P (breakdown of an equipment) = P (T < to) 0.1 to = 4.22 months
b) If to = 4.22 months P (will go for at least another month | has survived 4.22 months) = ? = P (T > 5.22 | T > 4.22) = 0.6 = 0.749
Other distributions • Exponential distribution • Triangular distribution • Uniform distribution • Rayleigh distribution p.224-225: table of common distribution
Exponential distribution fX(x) l x x 0
Example of application • Quake magnitude • Gap between cars • Time of toll booth operative
Example: Given: mean earthquake magnitude = 5 in Richter scale P (next quake > 7)
Shifted exponential distribution • Lower bound not necessarily 0 x a
Beta distribution fX(x) x q = 2.0 ; r = 6.0 probability b = 12 a = 2.0
Standard beta PDF (a = 0, b = 1) fX(x) q = 1.0 ; r = 4.0 q = r = 3.0 q = 4.0 ; r = 2.0 q = r = 1.0 x
Bernoulli sequence and binomial distribution • Consider the bulldozer example • If probability of operation = p and start out with 3 bulldozers, what is the probability of a given number of bulldozers operative?
X = 3 X = 2 X = 1 X = 0 Let X = no. of bulldozers operative ppp GGG GGB GBG BGG BBG BGB GBB BBB 3pp(1-p) 3p(1-p)(1-p) (1-p)3 binomial coefficients
Suppose start out with 10 bulldozers P (8 operative) = P( X=8 ) If p = 0.9, then P (8 operative)
Bernoulli sequence S F • Discrete repeated trials • 2 outcomes for each trial • s.i. between trials • Probability of occurrence same for all trials p = probability of a success
Binomial distribution S F x = number of success p = probability of a success P ( x success in n trials) = P ( X = x | n, p)
Examples • Number of flooded years • Number of failed specimens • Number of polluted days
Example: Given: probability of flood each year = 0.1 Over a 5 year period P ( at most 1 flood year) = P (X =0) + P(X=1) = 0.95 + 0.328 = 0.919
P (flooding during 5 years) = P (X 1) = 1 – P( X = 0) = 1- 0.95 = 0.41
For binomial distribution E (no. of success ) = E(X) = np Over 10 years, expected number of years with floods E (X) = 10 0.1 = 1
Return period Geometric distribution In general, T = time to first success P (T = t) = (1-p)t-1p t=1, 2, … geometric distribution
P (2nd flood in 3rd year) = P (1 flood in first 2 years) P (flood in 3rd year)
In general P (kth flood in tth year) = P (k-1 floods in t-1 year) P (flood in tth year) negative binomial distribution
Review of Bernoulli sequence • No. of success binomial distribution • Time to first success geometric distribution • E(T) =1/p = return period
Significance of return period in design Service life Suppose中銀 expected to last 100 years and if it is designed against 100 year-wind of 68.6 m/s design return period P (exceedence of 68.6 m/s each year) = 1/100 = 0.01 P (exceedence of 68.6 m/s in 100th year) = 0.01
P (1st exceedence of 68.6 m/s in 100th year) = 0.99990.01 = 0.0037 P (no exceedence of 68.6 m/s within a service life of 100 years) = 0.99100 = 0.366 P (no exceedence of 68.6 m/s within the return period of design) = 0.366
If it is designed against a 200 year-wind of 70.6 m/s P (exceedence of 70.6 m/s each year) = 1/200 = 0.005 P (1st exceedence of 70.6 m/s in 100th year) = 0.995990.005 = 0.003
P (no exceedence of 70.6 m/s within a service life of 100 years) = 0.995100 = 0.606 > 0.366 P (no exceedence of 70.6 m/s within return period of design) = 0.995200 = 0.367
How to determine the design wind speed for a given return period? • Get histogram of annual max. wind velocity • Fit probability model • Calculate wind speed for a design return period
Frequency N (72,8) 0.01 V100 Example Annual max wind velocity Design for return period of 100 years: p = 1/100 = 0.01 V100 = 90.6 mph
T 4300 years Alternative design criteria 1 Suppose we design it for 100 mph, what is the corresponding return period?
Probability of failure Pf = P (exceedence within 100 years) = 1- P (no exceedence within 100 years) =1- (1-0.000233)100 = 0.023


