Download
1 / 27
270 likes | 580 Views
Isotopes. Today’s lecture. Update: Midterm graded Today: What are isotopes Radioactive decay Age dating Isotopes as fingerprint. Spider Diagrams. Rock/Chondrites. 1000. 100. 10. 1. Rb. Ba. Th. Nb. K. La. Ce. Sr. Nd. Sm. Zr. Ti. Gd. Y.

E N D
Today’s lecture Update: Midterm graded Today: What are isotopes Radioactive decay Age dating Isotopes as fingerprint
Spider Diagrams Rock/Chondrites 1000 100 10 1 Rb Ba Th Nb K La Ce Sr Nd Sm Zr Ti Gd Y Fig. 9-5. Spider diagram for an alkaline basalt from Gough Island, southern Atlantic. After Sun and MacDonough (1989). In A. D. Saunders and M. J. Norry (eds.), Magmatism in the Ocean Basins. Geol. Soc. London Spec. Publ., 42. pp. 313-345.
REE/Spider Diagrams II 8.00 Eu* 6.00 4.00 sample/chondrite 2.00 0.00 56 58 60 62 64 66 68 70 72 La Ce Nd Sm Eu Tb Er Yb Lu Element 2 1 Figure 9-5. From Winter (2001) An Introduction to Igneous and Metamorphic Petrology. Prentice Hall.
Examples 10.00 67% Ol 17% Opx 17% Cpx 8.00 6.00 sample/chondrite 4.00 2.00 0.00 56 La Ce Nd Sm Eu Tb Er Yb Lu 58 60 62 64 66 68 70 72 10.00 10.00 57% Ol 14% Opx 14% Cpx 14% Grt 8.00 60% Ol 15% Opx 15% Cpx 10%Plag 8.00 6.00 6.00 sample/chondrite sample/chondrite 4.00 4.00 2.00 2.00 0.00 0.00 56 La Ce Nd Sm Eu Tb Er Yb Lu 58 60 62 64 66 68 70 72 La Ce Nd Sm Eu Tb Er Yb Lu
Batch Melting 1000 C 1 What’s Di? = L - + C Di (1 F) F O 100 D = 0.001 10 CL/CO D = 0.1 D = 0.5 1 D = 1 D = 2 D = 4 D = 10 0.1 0 0.2 0.4 0.6 0.8 1 F CL, CO = liquid, solid concentration F = fraction melt produced = melt/(melt + rock) • D = 1 = even split, • D < 1 = incompatible in minerals => enriched in melt • D > 1 = compatible in minerals => depleted in melt Figure 9-2. From Winter (2001) An Introduction to Igneous and Metamorphic Petrology. Prentice Hall.
Fractional melting, and others Separation of each melt drop as it formed CL/CO = (1/D) * (1-F) (1/D -1) • Crystallization like melting • Wall-rock assimilation • Zone refining • Combinations of processes Cox, Bell, Pankhurst
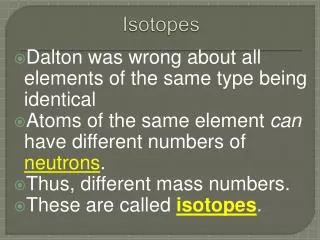
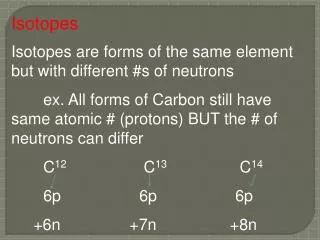
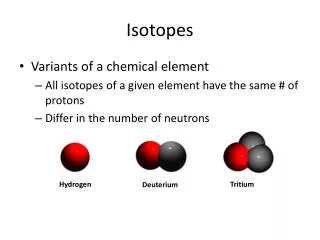
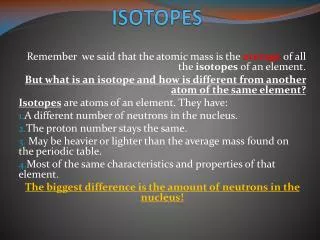
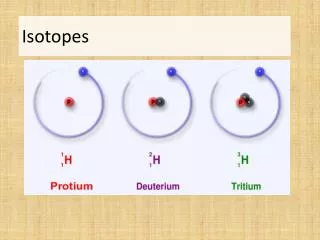
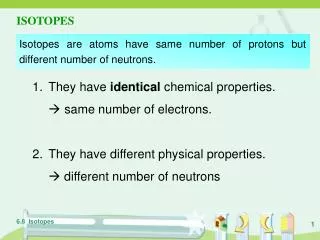
The Nature of Matter - Elements # Protons is fixed, # Neutrons can vary (isotopes with different mass #) • Hydrogen (1,2,3) (Average in nature is 1.008) • Iron (54,56,57,58) (Average in nature is 55.85) • Uranium (234,235,238) (Average in nature is 238.03) • 88 Naturally occurring elements - some have >1 isotopes • 8 elements make up > 98% of Earth’s crust (O, Si, Al, Fe, Ca, Mg, K, Na)
Isotopic fractionation Isotopic variations between rocks, etc. due to: 1. Mass fractionation (as for stable isotopes) 2. Daughters produced in varying proportions resulting from previous event of chemical fractionation separating parent from daughter 3. Time…(next slide) Example: 40K 40Ar by radioactive decay Basalt rhyolite by FX (a chemical fractionation process) Rhyolite has more K than basalt 40K more 40Ar over time in rhyolite than in basalt 40Ar/39Ar ratio will be different in each
Radioactive Isotopes & Decay 1 ½ ¼ # parent atoms time
Isochron method Divide by stable 86Sr: 87Sr/86Sr = (87Sr/86Sr)o + (87Rb/86Sr)(elt -1) l = 1.4 x 10⁻¹¹ a-1 y = b + x m = equation for a line in 87Sr/86Sr vs. 87Rb/86Sr plot Slope = (elt -1)
( ) 87Sr 86Sr o 87Sr 87Rb 86Sr 86Sr to a b c
( ) 87Sr 86Sr o 87Rb 87Sr 86Sr 86Sr t1 c1 b1 a1 to a b c
( ) 87Sr 86Sr o 87Sr 87Rb 86Sr 86Sr t2 c2 t1 b2 c1 a2 b1 a1 to a b c
87Rb 87Sr 86Sr 86Sr Isochron Technique t2 c2 t1 b2 c1 a2 b1 a1 to a b c
0.725 Rb-Sr Isochron, Eagle Peak Pluton, Sierra Nevada Batholith x Sr/ Sr = 0.00127 ( Rb/ Sr) + 0.70760 87 86 87 86 0.720 0.715 0.710 0 2 4 6 8 10 12 14 87 S r/ 87 86 Rb/ S r 86 Sr Isochron results Figure 9-9. After Hill et al. (1988). Amer. J. Sci., 288-A, 213-241.
Making Sr isotope reservoirs Figure 9-13. After Wilson (1989). Igneous Petrogenesis. Unwin Hyman/Kluwer.
Decay equation Sm-Nd 147Sm 143Nd by alpha decay l = 6.54 x 10⁻¹³ a-1 (half life 106 Ga) • Decay equation (144Nd non-radiogenic) • 143Nd/144Nd = (143Nd/144Nd)o + (147Sm/144Nd)(elt-1)
Evolution opposite to Rb - Sr Figure 9-15. After Wilson (1989). Igneous Petrogenesis. Unwin Hyman/Kluwer.
Nd isotopes vs Sr isotopes W. White