Download
1 / 1
10 likes | 128 Views
Graph 2: Size of the ICT sector in overall economy, EU and US. Graph 4: Contribution of ICT and non-ICT sectors of total BERD intensity % of GDP, EU and US. Graph 3: Share of subsectors in ICT Value Added, EU and US. 2,0%. 1,8%. NON-ICT BERD/GDP. ICT BERD/GDP. 1,6%. 1,4%. 1,23%. 1,2%.

E N D
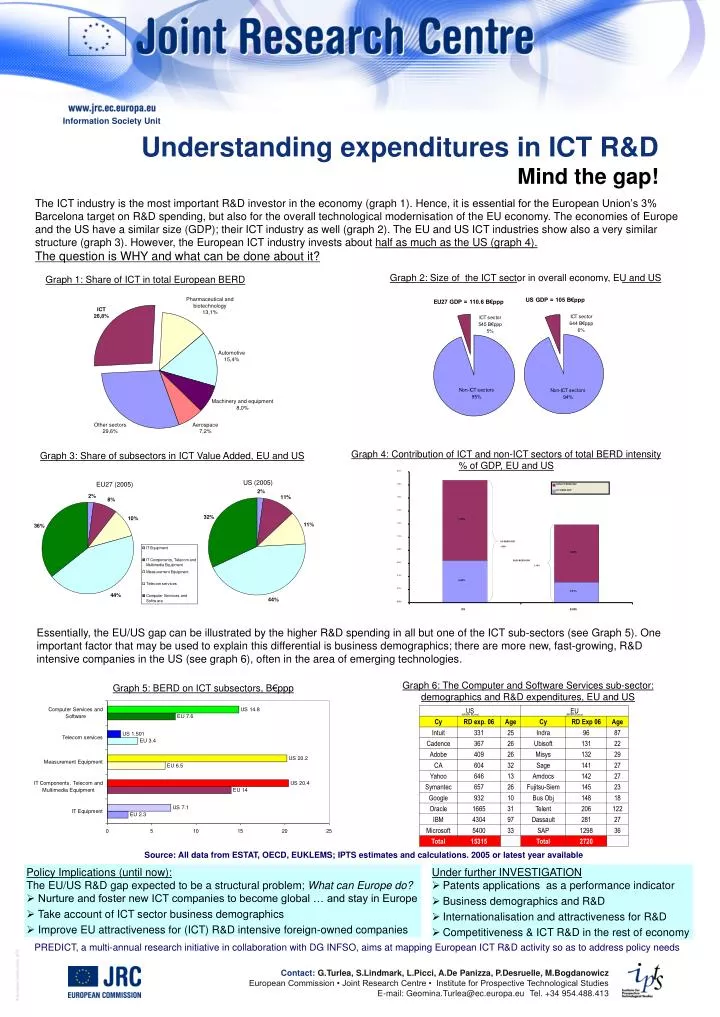
Graph 2: Size of the ICT sector in overall economy, EU and US Graph 4: Contribution of ICT and non-ICT sectors of total BERD intensity% of GDP, EU and US Graph 3: Share of subsectors in ICT Value Added, EU and US 2,0% 1,8% NON-ICT BERD/GDP ICT BERD/GDP 1,6% 1,4% 1,23% 1,2% 1,0% US BERD/GDP 1,88% 0,8% 0,88% EU25 BERD/GDP 0,6% 1,19% 0,4% 0,65% 0,2% 0,31% 0,0% US EU25 Information Society Unit Understanding expenditures in ICT R&D Mind the gap! The ICT industry is the most important R&D investor in the economy (graph 1). Hence, it isessential for the European Union’s 3% Barcelona target on R&D spending, but also for the overall technological modernisation of the EU economy. The economies of Europe and the US have a similar size (GDP); their ICT industry as well (graph 2). The EU and US ICT industries show also a very similar structure (graph 3). However, the European ICT industry invests about half as much as the US (graph 4). The question is WHY and what can be done about it? Graph 1: Share of ICT in total European BERD Essentially, the EU/US gap can be illustrated by the higher R&D spending in all but one of the ICT sub-sectors (see Graph 5). One important factor that may be used to explain this differential is business demographics; there are more new, fast-growing, R&D intensive companies in the US (see graph 6), often in the area of emerging technologies. Graph 6: The Computer and Software Services sub-sector: demographics and R&D expenditures, EU and US Graph 5: BERD on ICT subsectors, B€ppp (Million Euros) (Million Euros) Source: All data from ESTAT, OECD, EUKLEMS; IPTS estimates and calculations. 2005 or latest year available • Policy Implications (until now): • The EU/US R&D gap expected to be a structural problem; What can Europe do? • Nurture and foster new ICT companies to become global … and stay in Europe • Take account of ICT sector business demographics • Improve EU attractiveness for (ICT) R&D intensive foreign-owned companies • Under further INVESTIGATION • Patents applications as a performance indicator • Business demographics and R&D • Internationalisation and attractiveness for R&D • Competitiveness & ICT R&D in the rest of economy PREDICT, a multi-annual research initiative in collaboration with DG INFSO, aims at mapping European ICT R&D activity so as to address policy needs Contact: G.Turlea, S.Lindmark, L.Picci, A.De Panizza, P.Desruelle, M.Bogdanowicz European Commission • Joint Research Centre • Institute for Prospective Technological Studies E-mail: Geomina.Turlea@ec.europa.eu Tel. +34 954.488.413