Download

1 / 9
120 likes | 432 Views
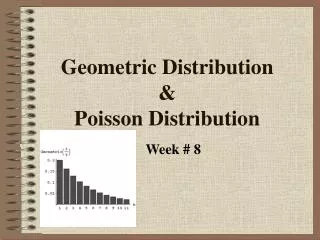
Poisson Distribution. Goals in English Premier Football League – 2006/2007 Regular Season. Poisson Distribution. Distribution often used to model the number of incidences of some characteristic in time or space: Arrivals of customers in a queue Numbers of flaws in a roll of fabric

E N D
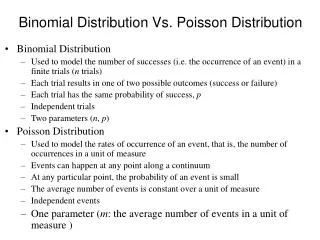
Poisson Distribution Goals in English Premier Football League – 2006/2007 Regular Season
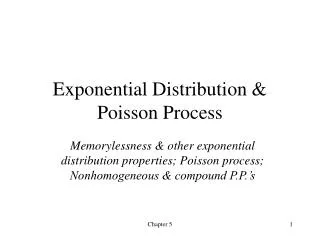
Poisson Distribution • Distribution often used to model the number of incidences of some characteristic in time or space: • Arrivals of customers in a queue • Numbers of flaws in a roll of fabric • Number of typos per page of text. • Distribution obtained as follows: • Break down the “area” into many small “pieces” (n pieces) • Each “piece” can have only 0 or 1 occurrences (p=P(1)) • Let l=np≡ Average number of occurrences over “area” • Y ≡ # occurrences in “area” is sum of 0s & 1s over “pieces” • Y ~ Bin(n,p) with p = l/n • Take limit of Binomial Distribution as n with p = l/n
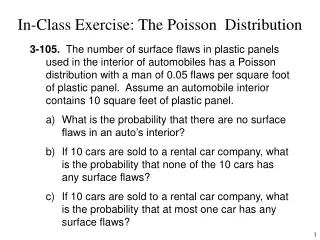
Example – English Premier League • Total Goals Per Game (Both Teams) • Mean=2.47 Variance=2.49 • Goals by Team by Half • Home Team, 1st Half: Mean=0.68 Variance=0.73 • Road Team, 1st Half: Mean=0.44 Variance=0.39 • Home Team, 2nd Half: Mean=0.77 Variance=0.75 • Road Team, 2nd Half: Mean=0.58 Variance=0.83* *Does not reject based on Goodness-of-Fit test
Goals by Team by Half Observed Counts Expected Counts Under Poisson Model
Goodness of Fit Tests (Lumping 3 and More Together for Team Halves)