Download
1 / 7
70 likes | 261 Views
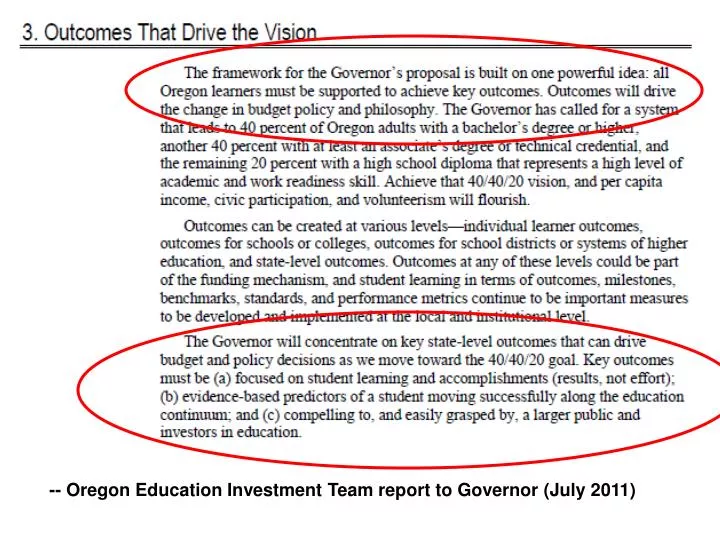
-- Oregon Education Investment Team report to Governor (July 2011). -- Oregon Learns , OEIB Report (December, 2011). NGA Measurement Considerations. Inputs Outcomes . Simple Complex . Equivalent Weighted . Available Data In Development . Single Year Multiple Years .

E N D
-- Oregon Education Investment Team report to Governor (July 2011)
NGA Measurement Considerations Inputs Outcomes Simple Complex Equivalent Weighted Available Data In Development Single Year Multiple Years Status Growth Parity Risk Adjusted
Achievement Compact School & District Report Card Policymakers -- State & District Parents & Public Priority/Focus/Model Designation Guide budget & policy setting at state & local level to improve achievement Educators & Community Student-level data Provide ratings & information about school & district quality Students, Families, & Teachers Focus state & district school improvement efforts. Inform teaching & learning
Policymakers -- State & District Parent & Public Students, Families, & Teachers Audience Guide budget & policy setting at state & local level to improve achievement Provide ratings & information about school & district quality Inform teaching & learning Purpose Achievement Compact School Report Card Student-level data Tool Subgroup & All Student Graduation Rates College Enrollment Rates College credits in HS 9th grade on track 3rd grade reading Summative Assessments: Proficiency & Growth Comparable school data Disaggregated Data Attendance Discipline ELL exiting Classroom-based assessment Student, Parent, and/or Teacher Satisfaction Survey Teacher/Leader Effectiveness Extra-curricular participation Screening/Monitoring Data Formative assessment Next-level Surveys Student health data Indicator
Achievement Compact (School Districts) • 40-40-20 as overarching outcome • A small number of key predictors of HS completion • Connections to workforce and college? Next Generation Report Card (Schools) • A more comprehensive set of indicators of school success (surveys, annual assessments, student growth) Class and Student-level data • Formative and summative assessment, attendance, observation, etc.


![2011 ITRS Emerging Research Materials [ERM] July 10-13, 2011](https://cdn2.slideserve.com/4220097/2011-itrs-emerging-research-materials-erm-july-10-13-2011-dt.jpg)