Download

1 / 60
640 likes | 989 Views
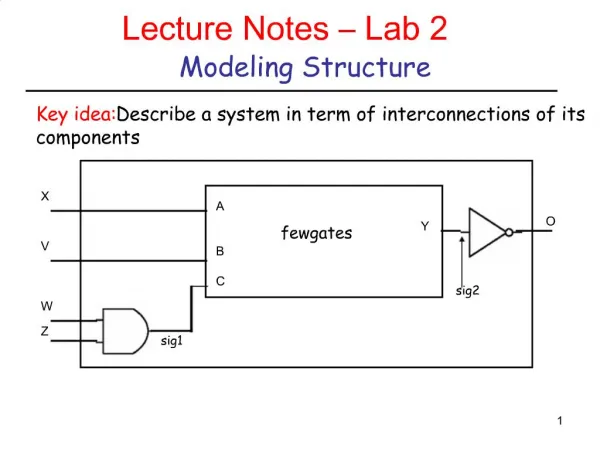
June 11, 2012 Molecular Modeling and Simulation. Complex Structure Modeling. Agricultural Bioinformatics Research Unit, Graduate School of Agricultural and Life Sciences, The University of Tokyo Tohru Terada. Contents. Preparations for simulation Protein-protein docking

E N D
June 11, 2012 Molecular Modeling and Simulation Complex Structure Modeling Agricultural Bioinformatics Research Unit, Graduate School of Agricultural and Life Sciences, The University of Tokyo Tohru Terada
Contents • Preparations for simulation • Protein-protein docking • Protein-small molecule docking • Exercise • Perspectives of molecular simulation
Procedures for MD simulation • Preparation of the initial structure • Obtain the structure • Add missing atoms and residues • Add hydrogen atoms • Obtain ligand force field parameters • Solvate the system • Energy minimization • Assignment of the initial velovities • Equilibration • Production
Preparation of the initial structure (1) • Obtain the structure • Download the experimental structure from PDB (http://www.rcsb.org/pdb/) • Usually, simulations are performed for the biological units of the biomacromolecules. • Example: Ribonuclease T1 (PDB ID: 1I0X) Asymmetric unit Biological Unit
Preparation of the initial structure (2) • Add missing atoms and residues • They can be added by using modeling software. • When N- or C-terminal residues are missing, you can block the terminus with an acetyl or N-methyl group. • Add hydrogen atoms • Most of them are added automatically. • Pay special attention to SS bonds and protonation states of His.
Operations in Discovery Studio (1) • Choose “File”→“Open URL” from the menu, enter “1I0X” for ID, and click “Open.” • Change Display Style to Line. • Select B, C, and D chains in Hierarchy Window and delete them. • Click “Macromolecules” button and expand “Protein Report” in the Tools tab. • Click “Protein Report.”→Check Incomplete or Invalid Residues. (Lys41, Asp49, Glu102 are colored purple.) • Expand “Prepare Protein” in the Tools tab, and click “Clean Protein” in the Manual Preparation section. →Missing atoms are added.
Protonation states of His Protonation at δ Protonation at ε Protonation at δ and ε • pKa of His side chain is close to neutral (~ 6.5). • You can find the protonation state from the hydrogen bond network where His is involved.
Operations in Discovery Studio (2) • Check the interactions of His27, His40, Glu58, and His92 with their surroundings. • Apply CHARMm force field, click “Calculate Protein Ionization and Residue pKa” in Protonate Protein section of Prepare Protein, and click “Run.”→Check the protonation states of the residues. His27 His92 Glu58 His40
Preparation of the initial structure (3) • Obtain ligand force field parameters • Ligand force field parameters are not included in the molecular dynamics software. It is necessary to make them by yourself or to obtain them from Amber Parameter Database.* • Solvate the system • For an accurate and efficient simulation using the PME method, solvate system in a rectangular water box. • Add counterions to neutralize the system. *http://www.pharmacy.manchester.ac.uk/bryce/amber
Equilibration • In the initial structure, there is a space between the protein and the water. • It is necessary to optimize water arrangement by performing a constant-pressure MD simulation. • During the simulation, positions of protein atoms are restrained to their initial position and the restraints are gradually relaxed. Space around the protein Restrained constant-pressure MD simulation Decrease of volume
Complex structure modeling • Predicts protein-protein or protein-small molecule complex structure. • If an experimental structure of similar complex is available, you should try following methods: • Homology modeling • Structure superposition • If not, try • Docking simulation
Structure superposition (1) • Start Discovery Studio 3.0 Client. • Choose “File”→“Open URL” from the menu, set ID to “1GUA” (complex of Rap1Aand Ras binding domain of Raf-1), and click “Open.” • Choose “File”→“Insert From”→“URL”, set ID to “5P21” (Ras), and click “Open.” • Click “Macromolecules” button, expand “Align Sequences and Structures”, click “Align Structures” in the Align by Structure Similarity section, and click “Run.”
Structure superposition (2) • Result is displayed in a new Molecule Window. Change Display Style to Line. • Hide Rap1A structure. • Choose “Structure”→“Monitor”→“Intermolecular Bumps” to display bumps between proteins. Ras Raf-1
+ receptor ligand complex Docking simulation • Dock a ligand into ligand-binding site on the surface of a receptor protein. • Different methods are used depending on the type of ligand (protein or small molecule).
+ receptor ligand complex Binding free energy Binding free energy is related with dissociation constant.
Components of binding free energy • Free energy is the sum of potential energy, volume-dependent term, and entropy-dependent term. • Receptor-ligand interaction: ΔEint < 0→stabilizing • Desolvation: ΔEdesolv > 0→destabilizing • Restriction on the conformational flexibility: ΔSconf< 0→destabilizing • Release of bound water:ΔSwat< 0→stabilizing
Calculation of binding free energy • Energy method • Considers only change in potential energy. • Ignores effects of solvation and conformational entropy. • MM-PB/SA method • Calculates the free energy from potential energy, solvation energy derived from Poisson-Boltzmann equation and surface area model, and conformational entropy obtained from vibrational analysis. • Free-energy perturbation method • Calculates free-energy change by the substitution of a functional group. • Gives an accurate result only when the structural difference caused by the substitution is very small. • Score function
Protein-protein docking • Both of receptorand ligand are treated as rigid bodies. Conformational changes upon complex formation are not considered. • Three translational and three rotational degreesof freedom of ligand areconsidered. • Rotation is described withEuler angle. • Shape complementarity isimportant. http://en.wikipedia.org/wiki/Euler_angles
Shape complementarity (1) Receptor Ligand = 1 (solvent accessible surface layer) = 9i (solvent excluding surface layer)
Shape complementarity (2) Calculate product of scores for each grid. Real part of sum of products = Docking score = 4
Shape complementarity (3) = –81 Calculate product of scores for each grid. Real part of sum of products = Docking score = 3–81 = –78
Efficient calculation • GeneralizationFind ligand position (a, b, c) that maximizes S. • S can be efficiently calculated with fast Fourier transform(FFT). • S is calculated for different ligand orientation. • It is possible to calculated electrostatic and other interactions in a similar manner.
Docking software • FTDockhttp://www.sbg.bio.ic.ac.uk/docking/ftdock.html • ZDockhttp://zlab.bu.edu/zdock/index.shtml • HEXhttp://www.loria.fr/~ritchied/hex/ • DOThttp://www.sdsc.edu/CCMS/DOT/ • GRAMM-Xhttp://vakser.bioinformatics.ku.edu/resources/gramm/grammx
An application of ZDock • Complex of TEM-1 β-lactamase and its inhibitor • β-lactamase: 1ZG4 (receptor) • Inhibitor: 3GMU (ligand) Top ranked model Experiment (1JTG)
Protein-small molecule docking • Find the ligand-binding site on the surface of the receptor protein. Then, dock the ligand into the site. • Search the conformational space of ligand for the free-energy minimum “pose” by translating and rotating the ligand and rotating all the rotatable bonds in the ligand. • Usually, the receptor atoms are not moved. The receptor is treated as a rigid body.
Empirical score function (1) • Ludi • Binding free energy change is expressed as the sum of the hydrogen-bond term, ionic-interaction term, lipophilic-interaction term and the loss of free energy due to freezing of internal degrees of freedom in the ligand. • Coefficients ΔGx were determined by fitting the calculated free-energy values to the experimental data of 45 protein-small molecule complexes. Böhm (1994) J. Comput.-Aided Mol. Des.8, 243.
Empirical score function (2) Böhm (1994) J. Comput.-Aided Mol. Des.8, 243.
Potential of mean force(Pmf) Plot of free-energy along the reaction coordinate. Statistical potential r PMF State A State B Reaction coordinate (distance r)
Statistical potential • Potential of mean force(Pmf) • Plot of free-energy along the reaction coordinate. • Related with probability distribution function. • Probability distribution as a function of the distance between protein and ligand atoms, pij(r), was calculated for each pair of atom types i and j using 77 complex structures. Muegge & Martin (1999) J. Med. Chem.42, 791.
Application to drug discovery • In drug discovery, high-throughput screening(HTS) is used to efficiently and exhaustively search the compound library for drug candidates that tightly bind to the target protein. • It costs huge amount of money to establish the compound library and binding-assay system. • It is possible to evaluate the affinity of a ligand to the protein by docking simulation.→virtual screening
Virtual screening Proteinstructure Cavitydetection Compound library Disease-relatedgene product(receptor or enzyme) Dockingsimulation Select compounds with good scores Leadcompound
Compound library • Available Chemicals Directory (ACD) • Database of commercially available compounds. • http://accelrys.com/products/databases/sourcing/available-chemicals-directory.html • Includes about 3,870,000 compounds. • ZINC • ‘Ready-to-dock’ 3D-structure database provided by USCF. • http://zinc.docking.org/ • Includes about 21,000,000 compounds. • PubChem • Provided by NCBI. • http://pubchem.ncbi.nlm.nih.gov/ • Includes about 57,000,000 compounds.
Cavity detection • A ligand binds to the cavity on the surface of a protein. • SURFNET • http://www.biochem.ucl.ac.uk/~roman/surfnet/surfnet.html • Detects “gap regions” on the protein surface. • PASS • http://www.ccl.net/cca/software/UNIX/pass/overview.shtml • Detects cavities on the protein surface and ranks them. • Q-SiteFinder • http://www.bioinformatics.leeds.ac.uk/qsitefinder/ • Detects cavities on the protein surface and ranks them based on the interaction energy with CH4probe.
Docking software • DOCK • http://dock.compbio.ucsf.edu/ • Matches ligand atoms with spheres that represent the cavity. • AutoDock • http://autodock.scripps.edu/ • Optimizes empirical free-energy score with genetic algorithm(GA). • GOLD • http://www.ccdc.cam.ac.uk/products/life_sciences/gold/ • Optimizes score function with GA. • Only the translational, rotational, and torsional degrees of freedom of the ligand are considered and the flexibility of the protein is not considered.
Practice of docking simulation • Dock an inhibitor to N1 neuraminidase using Discovery Studio 3.0 Client. • Obtain crystal structure of N1 neuraminidase. • Detect cavity. • Obtain structure data of the inhibitor. • Perform docking simulation. • Analyze the result.
1. Structure of receptor • Open the structure of N1 neuraminidase (PDB ID: 2HU0). • The B chain in this structure binds oseltamivir(trade name: Tamiflu). • Select B–H chains and delete them. • Change Display Style to Line. Select and delete
2. Cavity detection • Apply “charmm27” force field to the protein. • Click “Receptor-Ligand Interactions” button, expand “Define and Edit Binding Site”, and click “Define Receptor: 2HU0.” • Click “From Receptor Cavities” in the Define Site section.→Cavities are displayed.
3. Structure of ligand (1) • Access PubChem (http://pubchem.ncbi.nlm.nih.gov/), enter “oseltamivir” in the query box and click “GO.” • Click the hit with CID 65028. • Save the structural data in 3D SDFon Desktop. • Open it with Discovery Studio 3.0. • Change the molecule’s name to“oseltamivir” in Molecule tab ofData Table. Check Click here
3. Structure of ligand (2) • Since the ethyl group is removed inthe liver, delete it from the structure. • Select atoms in the carboxyl group,and choose “Chemistry”→“Bond”→“Partial Double” from the menu. • Select the nitrogen atom of the NH2group and choose “Chemistry”→“Charge”→“+1” to change the charge to +1.(A hydrogen atom is automatically added.) • Apply “CHARMm” force fieldto the molecule. • Expand “Run Simulations”, click “Minimization”, and click “Run.” +1 Delete
4. Docking simulation • Activate the Molecule Window in which 2HU0 is displayed. • Click “Receptor-Ligand Interactions” button, expand “Dock Ligands”, and click “Dock Ligands (CDOCKER)” in Docking Optimization section. • Set Input Receptor,Input Ligands asshown here andclick “Run.”
CDOCKER • Developer • C. L. Brooks III, M. Vieth, et al. • Wu et al.J. Comput. Chem.24, 1549 (2003). • Potential energy function • CHARMm • Optimization method • Simulated annealing (SA) and energy minimization • In SA, the interaction energy is evaluated with a grid-based method. • In energy minimization, interaction energy is calculated by using the potential energy function.
5. Analysis of the result • When the calculation has finished, the result is shown in a new MoleculeWindow. Uncheck Visibility Locked of 2HU0 in Data Table. • Hide all the binding site indicators (Site 1–11). • Choose “Chemistry”→“Hydrogens”→“Hide.” • Docking poses are sorted in the descending order of –CDOCKER_ENERGY values below the second raw of Data Table.
Comparison with experiment (1) • Interactions between the ligand and the protein are illustrated in the Summary page of 2HU0 at the RCSB site. • Which pose shows similar interactions to those in the experimental structure? Click
Comparison with experiment (2) • Since the B chain of 2HU0 binds oseltamivir, the pose is directly compared with the experimental one by superimposing the B chain on the receptor protein. • The fifth-ranked pose is very close to the experimental one. • Note that the energy difference between the top-ranked and fifth-ranked poses is small.
Exercise • This table lists the activity of the analogues tested during the development of oseltamivir.(Oseltamivir acid is 6h.) • Dock one of the analogues to N1 neuraminidase. • Discuss the difference in the docking pose and the energy. Kim et al.J. Am. Chem. Soc.119, 681 (1997).
The State of molecular simulation • Feasible • Folding simulation of a small protein • Refinement of accurate models • Reproduction of thermal fluctuation and fast (up to microseconds order) motions • Difficult • Folding simulation of a large protein • Refinement of inaccurate models • Reproduction of slow motions • Cell-scale simulation
Time scale of protein dynamics 1 ps 1 ns 1 μs 1 ms 永山國昭 「生命と物質 生物物理学入門」より引用
Folding simulations Glu5 Thr6 Pro4 Asp3 Gly7 Tyr2 Thr8 Trp9 Yellow: NMR, Pink: Simulation Gray: NMR, Blue: Simulation Satoh et al.FEBS Lett.580, 3422 (2006). Simmerlinget al.J. Am. Chem. Soc.124, 11258 (2002).
An MD simulation of Aquaporin • The protein is embedded in a lipid bilayer and water molecules are arranged on both sides of the membrane. • Water permeation rateExpt.:3×10⁹ sec−1Simulation:16/ 10 ns→1.6×10⁹ sec−1 de Groot & GrubmullerScience294, 2353 (2001). de Groot & GrubmüllerCurr. Opin. Struct. Biol.15, 176 (2005).
Ligand-binding simulation • MD simulations of binding of the beta-blocker drugs, alprenolol, etc., to its receptor, β2-adrenergic receptor. • Binding rate constant • Experiment: 1.0×10⁷ M–1 s–1 • Simulation:3.1×10⁷ M–1 s–1 Droret al.PNAS108, 13118 (2011).