Download
1 / 42
420 likes | 524 Views
1-1 Overview 1- 2 Types of Data 1- 3 Abuses of Statistics 1- 4 Design of Experiments. Chapter 1 Introduction to Statistics. Statistics (Definition)

E N D
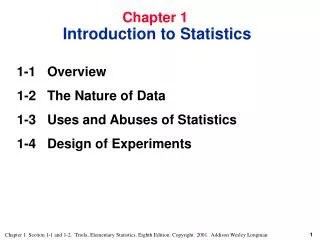
1-1 Overview 1- 2 Types of Data 1- 3 Abuses of Statistics 1- 4 Design of Experiments Chapter 1 Introduction to Statistics
Statistics (Definition) A collection of methods for planning experiments, obtaining data, and then organizing, summarizing, presenting, analyzing, interpreting, and drawing conclusions based on the data 1-1 Overview
Population The complete collection of all data to be studied. Sample The subcollection data drawn from the population. Definitions
Identify the population and sample in the study A quality-control manager randomly selects 50 bottles of Coca-Cola to assess the calibration of the filing machine. Example
Statistics Broken into 2 areas Descriptive Statistics Inferencial Statistics Definitions
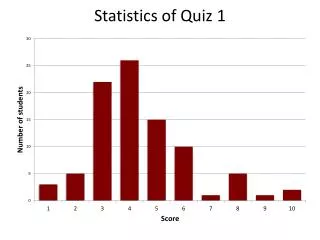
Descriptive Statistics Describes data usually through the use of graphs, charts and pictures. Simple calculations like mean, range, mode, etc., may also be used. Inferencial Statistics Uses sample data to make inferences (draw conclusions) about an entire population Definitions Test Question
Parameter vs. Statistic Quantitative Data vs. Qualitative Data Discrete Data vs. Continuous Data 1-2 Types of Data
Parameter a numerical measurement describing some characteristic of a population Definitions population parameter
sample statistic Definitions • Statistic • a numerical measurement describing some characteristic of a sample
Examples • Parameter • 51% of the entire population of the US is Female • Statistic • Based on a sample from the US population is was determined that 35% consider themselves overweight.
Definitions • Quantitative data • Numbers representing counts or measurements • Qualitative (or categorical or attribute) data • Can be separated into different categories that are distinguished by some nonnumeric characteristics
Examples • Quantitative data • The number of FLC students with blue eyes • Qualitative (or categorical or attribute) data • The eye color of FLC students
We further describe quantitative data by distinguishing between discrete and continuous data Definitions Discrete Quantitative Data Continuous
Discrete data result when the number of possible values is either a finite number or a ‘countable’ number of possible values 0, 1, 2, 3, . . . Continuous (numerical) data result from infinitely many possible values that correspond to some continuous scale or interval that covers a range of values without gaps, interruptions, or jumps Definitions 2 3
Discrete The number of eggs that hens lay; for example, 3 eggs a day. Continuous The amounts of milk that cows produce; for example, 2.343115 gallons a day. Examples
Univariate Data Involves the use of one variable (X) Does not deal with causes and relationship Bivariate Data Involves the use of two variables (X and Y) Deals with causes and relationships Definitions
Univariate Data How many first year students attend FLC? Bivariate Data Is there a relationship between then number of females in Computer Programming and their scores in Mathematics? Example
1. Center: A representative or average value that indicates where the middle of the data set is located 2. Variation: A measure of the amount that the values vary among themselves or how data is dispersed 3. Distribution: The nature or shape of the distribution of data (such as bell-shaped, uniform, or skewed) 4. Outliers: Sample values that lie very far away from the vast majority of other sample values 5. Time: Changing characteristics of the data over time Important Characteristics of Data
Almost all fields of study benefit from the application of statistical methods Sociology, Genetics, Insurance, Biology, Polling, Retirement Planning, automobile fatality rates, and many more too numerous to mention. Uses of Statistics
1-3 Abuses of Statistics • Bad Samples • Small Samples • Loaded Questions • Misleading Graphs • Pictographs • Precise Numbers • Distorted Percentages • Partial Pictures • Deliberate Distortions
Bad Samples Inappropriate methods to collect data. BIAS (on test) Example: using phone books to sample data. Small Samples (will have example on exam) We will talk about same size later in the course. Even large samples can be bad samples. Loaded Questions Survey questions can be worked to elicit a desired response Abuses of Statistics
Abuses of Statistics • Bad Samples • Small Samples • Loaded Questions • Misleading Graphs • Pictographs • Precise Numbers • Distorted Percentages • Partial Pictures • Deliberate Distortions
Salaries of People with Bachelor’s Degrees and with High School Diplomas $40,500 $40,500 $40,000 $40,000 30,000 35,000 $24,400 30,000 20,000 $24,400 25,000 10,000 20,000 0 Bachelor High School Degree Diploma Bachelor High School Degree Diploma (a) (b) (test question)
We should analyze the numericalinformation given in the graph instead of being mislead by its general shape.
Abuses of Statistics • Bad Samples • Small Samples • Loaded Questions • Misleading Graphs • Pictographs • Precise Numbers • Distorted Percentages • Partial Pictures • Deliberate Distortions
Double the length, width, and height of a cube, and the volume increases by a factor of eight What is actually intended here? 2 times or 8 times?
Abuses of Statistics • Bad Samples • Small Samples • Loaded Questions • Misleading Graphs • Pictographs • Precise Numbers • Distorted Percentages • Partial Pictures • Deliberate Distortions
Abuses of Statistics • Precise Numbers There are 103,215,027 households in the US. This is actually an estimate and it would be best to say there are about 103 million households. • Distorted Percentages 100% improvement doesn’t mean perfect. • Deliberate Distortions Lies, Lies, all Lies
Abuses of Statistics • Bad Samples • Small Samples • Loaded Questions • Misleading Graphs • Pictographs • Precise Numbers • Distorted Percentages • Partial Pictures • Deliberate Distortions
Partial Pictures “Ninety percent of all our cars sold in this country in the last 10 years are still on the road.” Problem: What if the 90% were sold in the last 3 years? Abuses of Statistics
Definition • Experiment • apply some treatment (Action) • Event • observe its effects on the subject(s) (Observe) • Example: Experiment: Toss a coin • Event: Observe a tail
Identify your objective Collect sample data Use a random procedure that avoids bias Analyze the data and form conclusions Designing an Experiment
Random (type discussed in this class) Systematic Convenience Stratified Cluster Methods of Sampling
Definitions • Random Sample • members of the population are selected in such a way that each has an equal chance of being selected (if not then sample is biased) • Simple Random Sample (of size n) • subjects selected in such a way that every possible sample of size n has the same chance of being chosen
Random Sampling - selection so that each has an equalchance of being selected
Systematic Sampling Select some starting point and then select every K th element in the population
Convenience Sampling use results that are easy to get
Stratified Sampling subdivide the population into at least two different subgroups that share the same characteristics, then draw a sample from each subgroup (or stratum)
Cluster Sampling - divide the population into sections (or clusters); randomly select some of those clusters; choose all members from selected clusters
Sampling Error the difference between a sample result and the true population result; such an error results from chance sample fluctuations. Nonsampling Error sample data that are incorrectly collected, recorded, or analyzed (such as by selecting a biased sample, using a defective instrument, or copying the data incorrectly). Definitions
Factorial Notation 8! = 8x7x6x5x4x3x2x1 Order of Operations ( ) POWERS MULT. & DIV. ADD & SUBT. READ LIKE A BOOK Keep number in calculator as long a possible Using Formulas