Download
1 / 21
210 likes | 341 Views
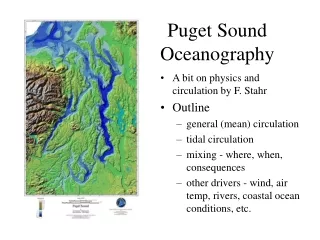
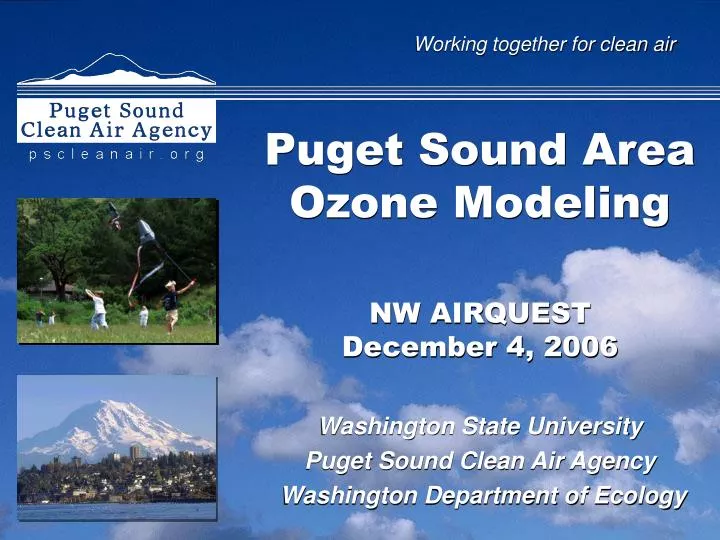
Puget Sound Area Ozone Modeling NW AIRQUEST December 4, 2006. Washington State University Puget Sound Clean Air Agency Washington Department of Ecology. Overview/Disclaimer. Presentation will NOT be an in-depth “technical” exploration of the models.

E N D
Puget Sound Area Ozone ModelingNW AIRQUESTDecember 4, 2006 Washington State University Puget Sound Clean Air Agency Washington Department of Ecology
Overview/Disclaimer Presentation will NOT be an in-depth “technical” exploration of the models. Presentation WILL show how a local agency tapped into local (NW AIRQUEST) modeling resources to help answer internal policy/planning questions.
Background – Stakeholder charge & Future Factors “Although the modeling results demonstrated minimal reductions in ozone concentration as a result of implementing the strategies … … the air quality benefits produced by the strategies could be an important contribution to remaining in attainment.” “…prudence requires that early identification of any potential impediments to remaining in attainment be vigorously pursued…” Previous WSU modeling, based on a 1996 ozone event, contributed to stakeholder process and adopted strategies Low Reid Vapor Pressure (RVP) gasoline Stage II vapor recovery Future Factors Moderate population and VMT growth Dramatic growth projected for local ports
Objectives and Improvements OBJECTIVES To determine if the Puget Sound area is likely to remain in attainment in the future, using more updated inventory and methods. To better understand the impact that low RVP gasoline has on ozone formation in the Puget Sound area. To better understand ozone formation through sensitivity analyses. IMPROVEMENTS/CHANGES CMAQ dispersion model (CALGRID used in previous) MOBILE6 mobile model (MOBILE 5B used in previous) Land surface model MM5 (simple soil MM5 in previous) 1998 ozone event (1998 concentrations higher than 1996) 1999 emission estimates (1996 NEI)
Modeling Project – Process and Design • Emissions Inventory Technical Group • PSCAA, Ecology, WSU • Inventory based largely on EPA’s 1999 National Emissions Inventory • Exception is non-road mobile (marine) • Base Case Year (1998) • Future Case Year (2015) • Two scenarios run, with and without low Reid Vapor Pressure (RVP) agreements • Sensitivity Runs • Runs increasing and decreasing VOC and NOX in different combinations
Emissions Inventory SummaryVOC, NOX emissions reduce 20, 25% Inventory for PSCAA Counties - King, Kitsap, Pierce, Snohomish
Results – High Ozone Sites • 2015 ozone levels lower than 1998 at highest ozone sites • High or low RVP gasoline made small difference in 2015 levels, less than 0.3 ppb at a monitor • Poor model performance on second and third day of event 1-hour ozone at Enumclaw. Red = 1998 observations, blue = 1998 model, green = 2015 model (low RVP)
Results – “Urban Core” Sites • Beacon Hill, near urban core, showed higher concentrations, in 2015 than 1998 • Higher concentrations moving closer to urban area • Ozone/NOX ratios increasing from 1998 to 2015, smaller band “VOC-limited” • Not important for attainment status, but may potentially have public health implication 1-hour ozone at Beacon Hill. Red = 1998 observations, blue = 1998 model, green = 2015 model
Results – Low RVP Agreement Difference between 2015 “high” and “low” RVP scenarios less than 1 ppb At individual monitoring sites, the difference is less than 0.3 ppb
Results – Sensitivity Analyses (based on 1998) • Reducing VOC (with NOX constant or increasing) yields most optimal ozone reductions
Uncertainties • Uncertainties in emissions inventory and projections • Uncertainties in meteorological and dispersion modeling • Under-prediction in second, third day of event • Future uncertainties • Lower future ozone NAAQS? • “Background” concentrations from developing countries • Climate change effect?
Results – Objectives Met? Modeling confirms previous results. The Puget Sound area is likely to remain in attainment in future years (with the current standard). Voluntary low RVP gasoline will make little difference as cleaner cars are incorporated into the fleet in future years. The region is “VOC limited.” VOC emissions reductions contribute to lower ozone concentrations. (caveat – sensitivity runs based on 1998 scenario).
Post-Model Discussions/Input… Results inform PSCAA Programs Voluntary Low Reid Vapor Pressure (RVP) gasoline in summer months Vapor recovery (Stage II) Continuous Improvement Possible model “metrics” (in addition to EPA’s guidance) Model improvements
Acknowledgements and Questions Many thanks to all who contributed: Washington State Department of Ecology Washington State University Region 10 Environmental Protection Agency Puget Sound Regional Council Puget Sound Clean Air Agency
Results – Pack Forest 1-hour ozone at Pack Forest. Red = 1998 observations, blue = 1998 model, green = 2015 model (low RVP)
Results – Model Performance • Overall, CMAQ model performance statistics met EPA guidance • 1-hour mean normalized bias and error of -3% and 21% (guidance is 15%, 35%) • 8-hour normalized bias of 1% (matched cell) and 9% (5 x 5 cells) • Very good agreement at Pack Forest • Under-prediction at Enumclaw sites • Likely due to meteorology and over-prediction of planetary boundary layer • Negative bias around 15% • When include surrounding cells, negative bias around 10% • Scatter diagram, quantile-quantile plot show good agreement between observed and predicted • MM5 modeling generally shows an index of agreement ~0.8 for wind speed, direction, temperature, and humidity.
Results – Test of Future AttainmentWeyerhauser Mill, Lake Sammamish, Pack Forest Designed to take model uncertainty account, using model in a relative sense. Very Conservative as it takes 5 years into account. • Calculate current design values (DVC) based on 4th high 8-hour concentrations • Calculate the relative reduction factor from modeling RRF = average 2015 8 hour max average 1998 8 hour max • Calculate future design value = DVC * RRF SITE RRF Future Design Value WM 0.90 68 ppb LS 0.97 58 ppb PF 0.94 68 ppb
Results – Sensitivity Analyses 8-Hour Ozone Standard Exceeded with Entire Source Categories Removed
Emissions Inventory SummaryTotal VOCs estimated to decrease ~ 20% Total 950 tons/day Inventory for PSCAA Counties - King, Kitsap, Pierce, Snohomish Total 750 tons/day
Emissions Inventory SummaryNOX Emissions Estimated to Decrease ~25% Inventory for PSCAA Counties - King, Kitsap, Pierce, Snohomish Total 400 Tons/Day