Download
1 / 45
460 likes | 569 Views
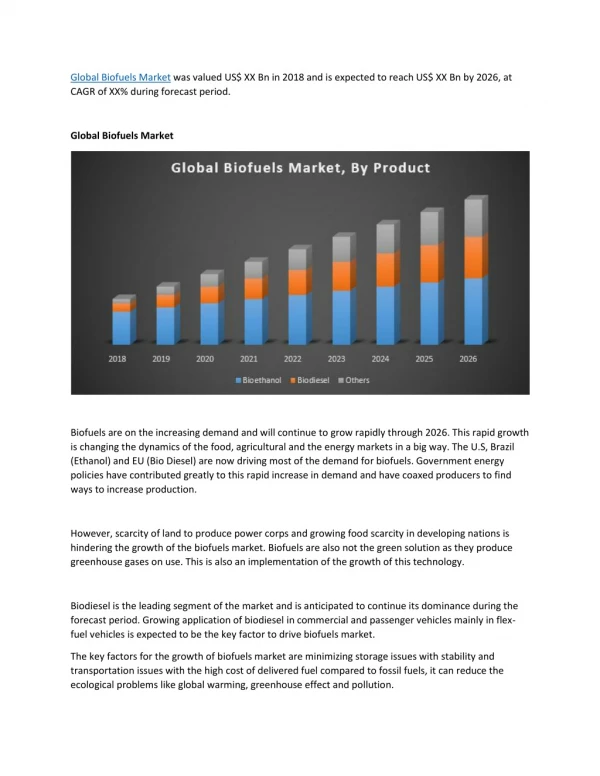
Global Economic Impacts of Biofuels. by Thomas Hertel Distinguished Professor of Agricultural Economics and Executive Director, Center for Global Trade Analysis Purdue University

E N D
Global Economic Impacts of Biofuels by Thomas Hertel Distinguished Professor of Agricultural Economics and Executive Director, Center for Global Trade Analysis Purdue University In collaboration with Jayson Beckman, Dileep Birur, Alla Golub, Roman Keeney, Farzad Taheripour, Wally Tyner, Nelson Villoria, Purdue University and Andy Jones, Michael O’Hare, Rich Plevin and Dan Kammen, Energy Resources Group, UC Berkeley Fanning Lecture: University of Georgia, November 13, 2009
Outline of Talk • Biofuels and the changing economic landscape facing agriculture • How green are biofuels? • US EISA; California ARB regulations require answering this question • Debate over “Indirect” Land Use Change (iLUC) • Key role for market-mediated effects • Global poverty impacts: • How biofuels affect the poor in developing countries • Estimated impacts
Biofuels have altered the agricultural economy’s landscape • Crop prices have become more closely linked to energy prices: • Historically main link was through input costs: fuel and fertilizer – significant, but not enough to dominate price linkage: corn-crude monthly price correlation: 2001-2007 = 0.32 • However, with 1/3 of the US corn crop going to ethanol, this has changed: 2007 – 2008 = 0.92
But we are now “hitting the Blend Wall” • US consumes about 140 billion gallons of gasoline type fuel annually, so a 10% blend limit would be a max of 14 billion gallons of ethanol • However, the effective blend limit is lower due to infrastructure limitations: • at the wall, there is more ethanol capacity than market absorptive capacity • ethanol price falls to breakeven with corn for marginal producer; ‘warm shutdown’ • ethanol tied closely to corn, but blend wall prevents further growth in capacity See also “Big time issues facing the ethanol industry” by Wally Tyner, 2009
Biofuels have altered the agricultural economy’s landscape • Crop prices have become more closely linked to energy prices: • Historically main link was through input costs: fuel and fertilizer – significant, but not enough to dominate price linkage: corn-crude monthly price correlation: 2001-2007 = 0.32 • However, with 1/3 of the US corn crop going to ethanol, this has changed: 2007 – 2008 = 0.92 • The combination of lower oil prices/binding RFS and hitting the blend wall loosens the corn-crude link; don’t necessarily respond to a rise in oil prices by boosting production: corn-crude price correlation: 2008/09 = 0.56
The correlation between corn and oil prices has changed over time as a consequence of ethanol Source: Beckman, Hertel and Keeney
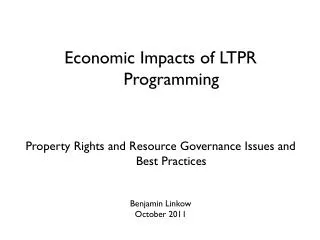
Biofuels have altered the agricultural economy’s landscape • Crop prices closely linked to energy prices • Ethanol industry has reached satiation • The livestock industry has been squeezed: • Hard hit by high commodity prices • In an attempt to reduce costs, livestock industry has become a major user of biofuel by-products; has altered the relative cost competitiveness of sectors • Livestock sectors’ ability to absorb by-products also key to success of biofuel sectors, as this is important revenue source for them: • 16% for corn ethanol production • 23% for rapeseed biodiesel • 53% soydiesel
Changes in Livestock Production Due to the US and EU 2015 Biofuel Mandates: 2006-2015 Other regions suffer because of higher crop prices/limited access to biofuel byproducts EU non-ruminants get a boost from lower priced oilseed meal Non-ruminants in US suffer due to low rate of displacement of DDGS for corn Source: Taheripour, Hertel and Tyner, 2009
Biofuels have altered the agricultural economy’s landscape • Crop prices closely linked to energy prices • Ethanol industry has reached satiation • The livestock industry has been squeezed • Introduced new sources of uncertainty into agricultural markets: • Petroleum prices increasingly key, but highly uncertain
Biofuels have altered the agricultural economy’s landscape • Crop prices closely linked to energy prices • Ethanol industry has reached satiation • The livestock industry has been squeezed • Introduced new sources of uncertainty into agricultural markets: • Petroleum prices increasingly key, but highly uncertain • Will the blend wall be adjusted? • Will corn ethanol be allowed in place of cellulosic in the RFS if the latter is not available in sufficient volume? • Will my biofuel be green?
Outline of Talk • Biofuels and the changing economic landscape facing agriculture • How green are biofuels? • US EISA; California ARB regulations require answering this question • Debate over “Indirect” Land Use Change (iLUC) • Key role for market-mediated effects • Potential poverty impacts through higher world food prices • How biofuels affect the poor in developing countries • Estimated impacts
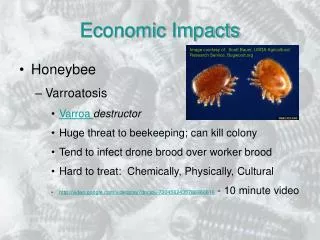
iLUC Background (1) • Prior to 2007, the general consensus was that corn ethanol reduced greenhouse gasses: • It is a renewable fuel – growth of corn sequesters carbon, this is released when the ethanol is burned, then start process again • Of course, corn production, transport, processing also requires energy, so net energy additions are less than 100%, not fully GHG neutral, but still deemed beneficial • Add to this other important co-benefits: • Boost farm incomes • Reduce dependence on imported oil • Looked like a real winner: Led to Renewable Fuel Standards as part of Energy Investment and Security Act (EISA) of 2007
US Renewable Fuel Standard: ensures 15byg corn ethanol... Provided it offers a 20% GHG improvement
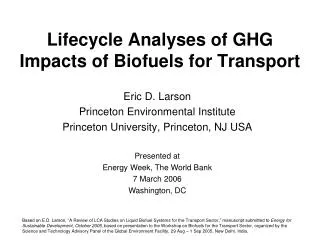
Net GHG contributions of corn ethanol (vs. net energy contribution) in absence of iLUC Source: Energy Resources Group, U.C. Berkeley
Presence of iLUC may greatly increase GHG emissions U.S. corn farmer switches from corn/soy to corn/corn Additional land in Brazil (for instance) is put into soy production U.S. soy exports go down and world soy prices rise Soy farmers everywhere use more inputs to increase yields ` Indirect LUC emissions Indirect process emissions Process emissions Source: Energy Resources Group, UC Berkeley
iLUC Background (2) • By the second half of 2007, the importance of indirect land use change induced emissions was circulating among professionals in the area • The EISA included a requirement that indirect land use changes be considered in estimating total GHG impacts for biofuels • In February 2008, Science published a paper by Searchinger, Heimlich (USDA), Fabiosa, El’Obeid, Lu, Tokoz, Hayes and Du (Iowa State University) estimating the size of these effects; greatly altered the GHG landscape for biofuels
Net GHG contributions in presence of iLUC (Searchinger et al. estimates) ? Source: Energy Resources Group, U.C. Berkeley
iLUCBackground (3) • Publication of Searchinger et al. has precipitated a series of studies aimed at sharpening estimates of iLUC • California Air Resources Board and UC Berkeley approached Purdue to undertake a joint study of iLUC for use in CARB’s Low Carbon Fuel Standard; chose to use GTAP model since publicly available; supported by consortium of world’s leading global economic orgs • In April 2009, CARB passed the LCFS, inclusive of iLUC estimates; the latter are based on GTAP analysis, undertaken at Purdue University • Model is publicly available for replication-critique-improvement
Land Conversion (Ha) and Emissions (TgCO2) due to increased US corn ethanol production Estimate cropland expansion into accessible forest land and pastures Greatest portion of land conversion occurs in US Land cover elasticities wrt to land rents based on historical estimates over period:1985 – 1997 Emissions factors based on Woods Hole estimates Source: CARB analysis, as documented in Hertel, Golub, Jones, O’Hare, Plevin and Kammen, 2009
What is the bottom line? • To play a meaningful role in reducing GHG emissions, must be significantly below gasoline: • Gasoline = 94-96 gCO2e/MJ • Direct emissions of US corn ethanol = 60-65g/MJ, according to CARB; lower values are possible with new technologies (possibly 45g/MJ) • Indirect emissions (with 30 year time horizon): • Searchinger et al = 100g/MJ • Purdue-Berkeley estimate for CARB = 27g/MJ with std deviation of 12g/MJ (considerable uncertainty remains) • What explains these differences? Many factors – explore here the market-mediated responses
Outline of Talk • How green are biofuels? • Background to debate over “Indirect” Land Use Change (iLUC) • Key role for global economic responses -- market-mediated effects • The bottom line • Potential poverty impacts through higher world food prices • How biofuels affect the poor in developing countries • Preliminary estimates of impacts
Understanding the GTAP estimates of iLUC: market-mediated effects are key Source: Hertel, Golub, Jones, O’Hare, Plevin and Kammen, 2009
Determining the impact on corn production of 13.25bgy rise in ethanol (2001-2015 cumulative impact) • Direct requirements: • Need to boost cgrns production by 42% • 15 Mha more land, ceteris paribus (holding all else constant) • But market-mediated adjustments: • Ethanol production does not exhaust feed value of corn; DDGS by products can be fed to livestock; also substitute other feeds for higher priced corn; 43% decline in sales of corn for livestock feeding; • Exports also fall, ceteris paribus • Cuts required rise in US production from 42% to 17%
Determining the impact on US corn area of 13.25bgy rise in ethanol(2001-2015 cumulative impact) • Increase in crop area required depends on what happens to yields: • Corn yields rise over time as a result of continuing improvements in varieties/technology; so land requirements to meet ethanol will fall over time • Corn yields are also responsive to price: higher prices boost yields above trend (intensive margin) • Corn yields tend to fall when expand area (extensive margin) • Further reduces area required in US
Determining the impact on RoW corn area of 13.25bgy rise in ethanol (2001-2015 cumulative impact) • Higher US prices, reduced exports, tend to boost production in Rest of the World (Row) • Where will production rise? Depends on the geography of international trade: • Total current area (sole basis for naïve prediction) • Intensity of US exports to that country • Intensity of their exports to US • Intensity of competition in third markets • To understand future, need to study past: statistical analysis of last 40 years’ global area changes in response to US price
Confidence intervals (95%) for the differences between the mean harvested areas predicted by the IWM and the Armington model, by country: Based on 1993 US cgrns production shortfall of 32 percent Armington Integrated World Market Source: Villoria, N. (2009) "Understanding the Global Land Use Impacts of Biofuels: The Role of Product Differentiation". Dissertation Essay #1.
Determining the impact on RoW Land Area • How much new cropland is required to offset reduced US exports depends on relative yields • Yields vary by country, so if new production arises in countries with high yields, less area is required
International corn yields vary by region RoW yields avg about 1/3 of US Comparison of corn yields (metric ton/ha) GTAP/SAGE is 1997-2003 average/ FAPRI is from the 2001/02 marketing year
Determining the impact on RoW Land Cover • How much new cropland is required to offset reduced US exports depends on relative yields • Yields vary by country • Yields vary by Agro-Ecological Zone (AEZ)
Global Distribution of AEZs Source: Lee et al. 2009
Yields vary within countries: China’s corn yields by AEZ Corn yields (metric ton/ha) GTAP/SAGE across AEZs for China (no corn is grown in AEZ18; no AEZs 1-3 in China)
Determining the impact on RoW Land Cover • How much new cropland is required to offset reduced US exports depends on relative yields • Yields vary by country • Yields vary by Agro-Ecological Zone (AEZ) • Which type of crop cover is converted depends on competition within AEZs; if pasture is prominent, more pastureland will be converted, similarly with forest land
Land Conversion (Ha) and Emissions (TgCO2) due to increased US corn ethanol production Geography matters: Greatest portion of land conversion occurs in US Overall, pasture conversion is most prominent Prominence of pasture (vs. forest) further reduces GHG emissions Finally, some modest afforestration in AEZs without biofuel feedstocks Source: CARB analysis, as documented in Hertel, Golub, Jones, O’Hare, Plevin and Kammen, 2009
What is the bottom line? • To play a meaningful role in reducing GHG emissions, must be significantly below gasoline: • Gasoline = 94-96 gCO2e/MJ • Direct emissions of US corn ethanol = 60-65g/MJ, according to CARB; lower values are possible with new technologies (possibly 45g/MJ) • Indirect emissions (with 30 year time horizon): • Searchinger et al = 100g/MJ • Purdue-Berkeley estimate for CARB = 27g/MJ with std deviation of 12g/MJ (considerable uncertainty remains) • Corn ethanol looks unlikely to make it in CA: • CA-LCFS: need to reduce total emissions to 46g/MJ if going to achieve desired 10% reduction based on 20% blend • US-EPA: need 77g/MJ (20% of gasoline); but mostly grandfathered in already – tied to climate change legislation
A focus on the consumption response • Impact of reduced consumption due to higher prices plays a significant role in reducing land requirements for biofuels; but largely overlooked • What if prevented reduction in consumption via food subsidies? In our work with UCB-ERG: • Estimate twice as much forest land conversion and • 50% higher GHG emissions from LUC when food consumption is fixed (do not adjust to higher food prices in the wake of increased biofuels) • However, most price responsive demand is in low income countries, where rates of poverty and malnutrition are highest; what are likely impacts of price rise on poverty?
Outline of Talk • Biofuels and the changing economic landscape facing agriculture • How green are biofuels? • Potential poverty impacts through higher world food prices • How biofuels affect the poor in developing countries • Estimated impacts
Focus Countries and Stratification for Biofuels/poverty study • Survey data availability determines country selection: • Disaggregated in v.6.2 GTAP data base • Household survey available to the World Bank • Disaggregation of income sources in survey • Leads to eighteen countries (currently targeting 24): • Africa: Malawi, Mozambique, Tanzania, Uganda, Zambia • Asia: Cambodia, Bangladesh, Indonesia, Pakistan, Philippines, Thailand, Vietnam • Latin America: Brazil, Colombia, Chile, Mexico, Peru, Venezuela • Stratification of households into 7 groups by earnings specialization (> 95% of income from one source): • Agr self-employment, non-agr self-employment, wage labor (rural and urban), transfer dependent, diversified (rural and urban)
The poor spend a disproportionate share of income on food and earn most of income from unskilled labor
Rural and transfer dependent hhlds are disproportionately poor
Medium run price impacts of EU-US biofuels growth: 2001-2015 using GTAP model (% change relative to baseline) Source: Hertel and Taheripour, 2009
Poverty impacts on individual strata are rather consistent (Sign Consistency = SC = Avg/AAV-- darker portion of avg is contribution of US biofuels) Percent change Source: Hertel and Taheripour, 2009
But national poverty impacts vary widely across 16 focus countries (% change) Poverty rises in much of Latin America African impacts smaller Poverty reductions in Asia Source: Hertel and Taheripour, 2009
Conclusions • Biofuels have fundamentally altered the economic landscape facing global agriculture • Closer link between energy and farm commodity prices • Introduces massive new uncertainties for agricultural entrepreneurs: • Energy markets • Biofuel policies • Climate policies • Controversy over GHG impacts of biofuels will continue due to uncertainty about underlying economic parameters; key role of market-mediated effects • However, we deal with such uncertainty all the time: • Confidence intervals • Bounding analysis • Focus on thresholds, not numerical values • Global poverty impacts are mixed: those whose income is tied to agriculture likely to gain, low income urban households likely to lose