Download
1 / 47
470 likes | 625 Views
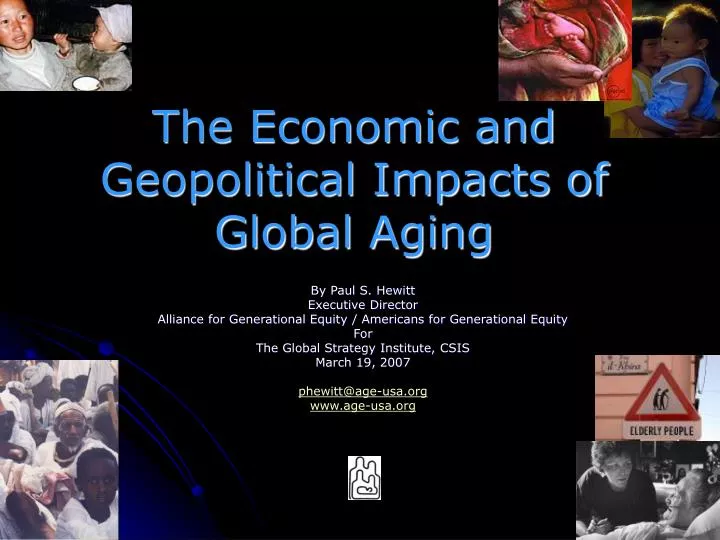
The Economic and Geopolitical Impacts of Global Aging. By Paul S. Hewitt Executive Director Alliance for Generational Equity / Americans for Generational Equity For The Global Strategy Institute, CSIS March 19, 2007 phewitt@age-usa.org www.age-usa.org.

E N D
The Economic and Geopolitical Impacts of Global Aging By Paul S. Hewitt Executive Director Alliance for Generational Equity / Americans for Generational Equity For The Global Strategy Institute, CSIS March 19, 2007 phewitt@age-usa.org www.age-usa.org
Global Aging is a global challenge requiring global solutions. • The developed world’s aging will take place in an increasingly interdependent global economy. • The economic, financial, and political effects of aging and depopulation in our home countries will be transmitted as shocks to other developed economies as well as to the developing world. • How developed countries manage their respective aging challenges could have geopolitical consequences that outweigh their domestic impacts.
The world is converging toward a median age in the mid-40s. Median age in selected years, 2000-2050
Demography and destiny, 2000-2050. • The least developed countries will remain very young—and probably very poor—for at least the next generation. • The emerging markets will age the most rapidly. However, declining and/or low total dependency over the next 30 years will provide an important economic boost. • The United States will see little increase in its median age, thanks to projected population growth of 47%.* Even so, old age dependency will rise significantly, with attendant economic and financial strains. • Decades of below replacement birthrates have set in motion a process of depopulation in Europe and parts of Asia, which will dramatically slow GDP growth amid steeply rising old age dependency. * U.S. Census Bureau (2004)
Rising life expectancy plays a major role in global aging Life Expectancy at Birth Source: UN (2004)
But falling fertility is more important Source: UN (2004)
Every G-7 country has seen fertility fall below the “replacement rate” of 2.1 children per woman—setting motion an era of population decline. UN (2004)
China’s baby boom: What happened when china’s child mortality suddenly Fell Median Age 1950 23.9 1970 19.7 1990 25.3 2010 34.9 baby boom generation birthrate Lifetime Births Per Woman child mortality
The UN projects that 29 countries will begin depopulating before 2025 Source: United Nations (2004)
South Korea’s Demographic Pyramid—1990 Median Age = 26.9 In 1950, there were 17 children under 20 for every Korean over 80 Source: Bureau of Census, UN Population Div. (2007)
South Korea’s Demographic Pyramid—1995 Median Age = 29.4 Source: Bureau of Census, UN Population Div. (2007)
South Korea’s Demographic Pyramid—2000 Median Age = 32.0 Source: Bureau of Census, UN Population Div. (2007)
South Korea’s Demographic Pyramid—2005 Median Age = 35.0 Source: Bureau of Census, UN Population Div. (2007)
South Korea’s Demographic Pyramid—2010 Median Age = 38.0 Source: Bureau of Census, UN Population Div. (2007)
South Korea’s Demographic Pyramid—2015 Median Age = 40.8 Source: Bureau of Census, UN Population Div. (2007)
South Korea’s Demographic Pyramid—2020 Median Age = 43.4 Source: Bureau of Census, UN Population Div. (2007)
South Korea’s Demographic Pyramid—2025 Median Age = 45.8 Source: Bureau of Census, UN Population Div. (2007)
South Korea’s Demographic Pyramid—2030 Median Age = 48.1 Source: Bureau of Census, UN Population Div. (2007)
South Korea’s Demographic Pyramid—2035 Median Age = 50.2 Source: Bureau of Census, UN Population Div. (2007)
South Korea’s Demographic Pyramid—2040 Median Age = 51.9 Source: Bureau of Census, UN Population Div. (2007)
South Korea’s Demographic Pyramid—2045 Median Age = 53.4 Source: Bureau of Census, UN Population Div. (2007)
South Korea’s Demographic Pyramid—2050 Median Age = 54.9 In 2050, there will be 1.4 Koreans over 80 for every child under 20 Source: Bureau of Census, UN Population Div. (2007)
Global aging poses five interconnected sets of risks for today’s developed countries • Economic risk: graying and shrinking workforce, stagnant or shrinking aggregate demand • Budget risk: rising retirement costs, flagging tax revenues • Financial risk: falling savings rates, rising public debt = possible global “capital crunch” • Social risk: flagging dynamism and unwillingness to accept change, rising intergenerational tension as all wage growth is consumed by higher taxes • Geopolitical risk: tight foreign affairs budgets, rising potential to export economic and financial crisis to volatile youthful and middle aged countries
Risks to Growth • Stagnant or declining labor forces • Declining rates of savings and investment • Falling demand, overcapacity, and declining profits • Rising tax burdens
Working-age populations in much of the EU and Japan will decline—in some cases, dramatically.
Slowing labor force growth will mean slower GDP growth SSA Actuary projections Source: SSA Office of the Actuary (2004)
Aging recessions: when the labor force declines faster than productivity grows Italy 1980-2050 Aging recession
Budgetary Risk • Declining support ratio of workers to retirees • Rising cost of pay-as-you-go retirement and health benefits even as revenue base stagnates or declines • Large tax hikes, large benefit cuts, or exploding public debt
If interest rates to rise in response to large and sustained budget deficits—as most economists believe would happen—interest on the debt could become the primary driver of deficits by the late-2020s CBO projections Hewitt projection Source: CBO (2005), author
America’s Health Cost Explosion Official Projections Point to National Health Expenditures of 24 Percent of GDP in 2030 Source: CMS, author’s calculations
Lower savings rates • Less financial risk taking? • Unsustainable government borrowing and possible debt crises throughout the developed world • Possible weakness in stock markets Financial risk
Saving and productivity growth • McKinsey Global: a $31 trillion “global capital shortfall” by 2024 due to declining in “prime saver” populations • Developed world growth in household financial wealth to slow from 4.5% a year historically to 1.3 %. • Japanese household financial wealth to decline by .2% annually. • Possible Consequences: • Slower economic growth as interest rates rise and productivity flags • Rising debt service costs for highly indebted countries • Stock market underperformance
“…a collective slide down the rating scale would commence early next decade.” Standard & Poors G-7 Public Debt Burdens as a Percentage of GDP Source: Standard & Poors, “The Western World Past it’s Prime—Sovereign Rating Perspectives in the Ageing Context” (March 2004)
Social risk • Will aged populations be less entrepreneurial? • Will slow or negative income growth undermine national morale, social tolerance? • Will aged electorates create tension by over-taxing workers? • Will aged societies be unwilling, or unable, to play a constructive role in foreign policy?
Younger populations tend to be more entrepreneurial. Median Age in 2005 Index of Total Entrepreneurship Activity Source: London Business School and Babson College, “2004 Global Entrepreneurship Report”; UN (2002)
Under CBO’s “intermediate” scenario, old age entitlements will rise from 45 percent of non-interest spending in 2005 to 68 percent by 2030 and 75 percent in 2050. Source: CBO (2005)
Stagnant non-health consumption: By the 2020s, increases in personal health expenditures plus taxes to pay for U.S. public pensions and health benefits could consume 96 percent of personal income growth Claims on per capita personal income growth, 1960-2030 $618 $555 $574 $467 $33 $482 $534 $486 Source: CMS, SSA, CBO and author’s calculations
When retirement saving is included, worker consumption levels begin to fall in 2014 Source: Schieber (2007)
“Not just in America but in the other Western democracies, too,history is replete with instances in which a turn away from openness and tolerance, often accompanied by a weakening of democratic institutions, has followed economic stagnation.” Benjamin Friedman, Harvard University “The Moral Consequences of Economic Growth” (2005)
Geopolitical risk • Widening global generation gap between richest and poorest nations • Uncertainties in the emerging markets • Waves of illegal immigration • Avoiding upheaval
Ratio of populations aged 0-14 and 65+ to population aged 15-64 Developed world dependency ratios Most population growth will be in the 65+ age groups Developing world dependency ratios Most population growth will be in the working ages
Third World Labor Glut During the next 25 years, working age populations will shrink by 31 million in the more developed regions and expand by 1.2 billion in the less developed regions Source: UN (2004)
In most regions, the most conflict-ridden nations are also the youngest… Greater Arabia Palestine 17.1 Iraq 19.1 South-central Asia Afghanistan 16.7 Tajikistan 19.3 Pakistan 20.0 Southeast Asia Timor-Leste 18.4 Laos 19.1 Sub-Saharan Africa 18.0 38% of Sub-Saharan countries have experienced Type 1 or Type 2 conflicts since 1990. Central America Guatemala 18.1 Nicaragua * 19.7 Caribbean Haiti 20.0 Dominican Republic ** 23.3 South America Bolivia 20.8 Paraguay 20.8 Europe Albania 20.2 Moldova 26.6 * 15.9 in 1975 ** 16.2 in 1965
Some 20th century conflicts were started by middle-aged countries with surging unemployment Median Age
Fastest aging Countries, 2005-2050: will middle-aging foster political stability? Source: UN World Population Prospects (2005 Revision)
Promoting social peace in the developing world • Unemployment: the founding impulse of the modern welfare state • Emerging markets experiencing “demographic window” of falling dependency characterized by near-term unemployment and long-term aging. They are relying on globalizataion to maintain social peace. • Middle-aged societies are more peaceful—except under conditions of severe economic distress.
Policy considerations. • International “peer pressure” needed to keep debt ridden “rich” countries from plunging world into financial upheaval • Globalization and productivity – economic integration with third world is the best way to assure growth in aging developed countries • World stock exchanges can help younger countries buy financial assets from aging developed world • Structure and design of welfare states (in both the developed and developing worlds) needs rethinking • Early retirement is a 20th century idea borne of labor surplus