Download

1 / 15
150 likes | 230 Views
Evidence for Impact on Student Learning. Tony Norman Associate Dean, CEBS. Roger Pankratz Assistant to the Dean, CEBS.

E N D
Evidence for Impact on Student Learning Tony Norman Associate Dean, CEBS Roger Pankratz Assistant to the Dean, CEBS • In P. R. Denner (Chair), Evidence for Impact on Student Learning from the Renaissance Teacher Work Sample Assessment. Symposium presented at the annual meeting of the American Association for Colleges of Teacher Education, New York, NY, February 2008.
WKU Participants Fifty-two TWS from two semesters (fall 2006 and 2007) selected to maximize variability in holistic scores (4 – Exemplary, 3 – Proficient, 2 – Developing, 1 – Beginning) 73% Elementary Education Majors 27% Middle Grades/Secondary Education Majors
Teacher Work Sample Scores • The WKU TWS uses an analytic scoring rubric with 7 targeted standards that are assessed using multiple indicators. • The indicators are scored on a 3-point scale: 1 = Indicator Not Met 2 = Indicator Partially Met 3 = Indicator Met • Summing across indicators, the total TWS scores can range from 32 to 96.
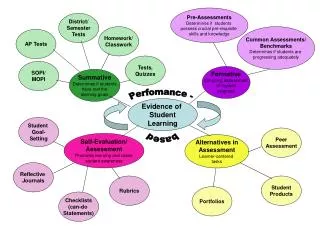
Learning Impact Measures Percent of students reaching “mastery” on each learning goal. Average Percent Reaching Mastery Percent Mastering Learning Goal 1 Percent Mastering Learning Goal 2 The candidates chose the learning goals and the difficulty of mastery level. Learning Goals had to fit the approved curriculum and align with Kentucky Core Content standards. However, the candidates set their own criteria for success on each learning goal.
Learning Impact Measures Percent of students showing improvement on each learning goal. Average Percent Showing Improvement Percent Showing Improvement on Learning Goal 1 Percent Showing Improvement on Learning Goal 2 Note: Candidates are encouraged to set Learning Goal 2 at a “higher level” in Bloom’s Taxonomy. Many of these are measured by candidate developed rubrics.
Regression Analyses for TWS Scores on the Reported Percent of Students Achieving Learning Goals
Regression Analyses for TWS Scores on the Reported Percent of Students Showing Improvement
A Closer Look at Key TWS Components 22 fall 2006 TWS were examined for quality of assessments 30 fall 2007 TWS were examines for quality of assessments and quality of unit learning objectives
Criteria for Judging Quality of TWS Assessment Alignment with unit objectives Addresses depth of knowledge (DOK) level Sufficient number of items Rubrics provide instructions for judgment
Criteria for Judging Quality of TWS Learning Objectives Aligned with Kentucky Content Standards Student friendly Scope – contribution to academic year Curriculum Map Measurable
Where WKU Teacher Candidates Appear to Need Improved instruction Writing clear, student friendly unit objectives Writing unit objectives for designated depth of knowledge (DOK) levels Developing classroom student assessments most appropriate for unit objectives Developing classroom student assessments aligned with designated DOK levels
For a Copy of the Presentation… http://edtech.wku.edu/rtwsc/publications-and-research.htm