Download
1 / 35
350 likes | 449 Views
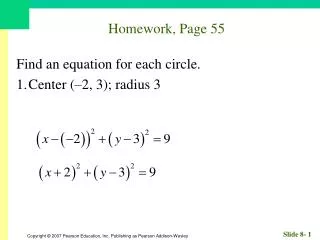
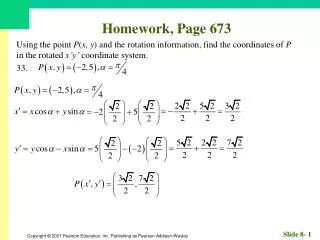
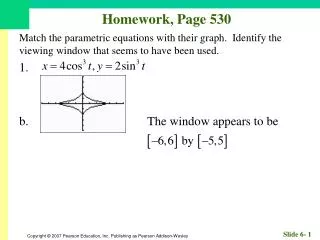
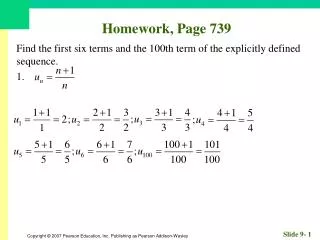
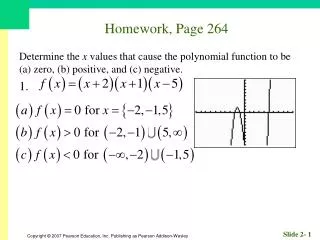
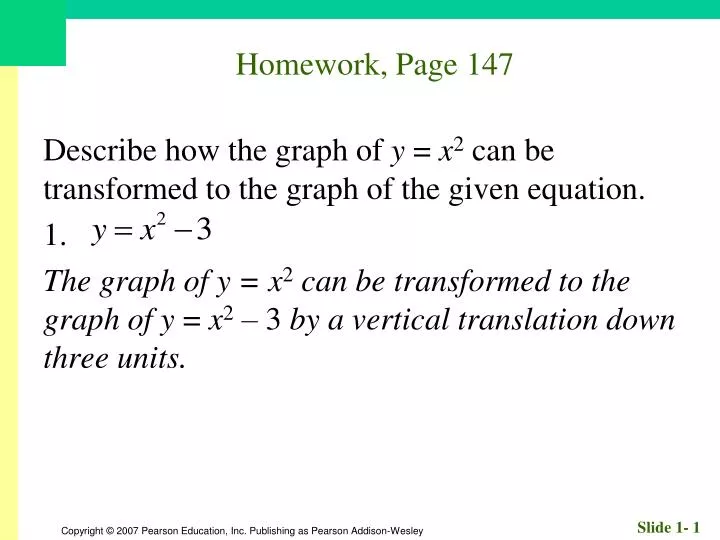
Homework, Page 147. Describe how the graph of y = x 2 can be transformed to the graph of the given equation. 1. The graph of y = x 2 can be transformed to the graph of y = x 2 – 3 by a vertical translation down three units. Homework, Page 147.

E N D
Homework, Page 147 Describe how the graph of y = x2 can be transformed to the graph of the given equation. 1. The graph of y = x2 can be transformed to the graph ofy = x2 – 3 by a vertical translation down three units.
Homework, Page 147 Describe how the graph of y = x2 can be transformed to the graph of the given equation. 5. The graph of y = x2 can be transformed to the graph ofy = (100 – x)2by a horizontal translation right 100 units.
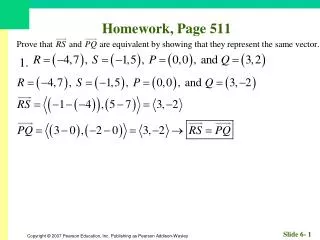
Homework, Page 147 Show that the graph of can be transformed to the graph of the given equation. 9. The graph of can be transformed to the graph ofby reflecting about the x–axis.
Homework, Page 147 Describe how the graph of y = x3 can be transformed to the graph of the given equation. 13. The graph of y = x3 can be transformed to the graph ofy = 2x3by a vertical stretch of 2.
Homework, Page 147 Describe how to transform the graph of f into the graph of g. 17. The graph of f can be transformed into the graph ofgby a horizontal translation six units right.
Homework, Page 147 Sketch the graphs of f, g, and h by hand. Support your answers with a grapher. 21.
Homework, Page 147 The graph is that of a function y = f(x) that can be obtained by transforming the graph of Write a formula for the function f. 25.
Homework, Page 147 Find the equation of the reflection of f across (a) the x–axis and (b) across the y–axis. 29.
Homework, Page 147 33. Prove that the graph of an odd function is the same when reflected across the x–axis as it is when reflected across the y–axis. An odd function is defined as f(–x) = –f(x). Reflecting y = f(x) across the x–axis yields y = –f(x). Reflecting y = f(x) across the y–axis yields y = f(–x). Since f(–x) = –f(x), we have the same reflection across both axes.
Homework, Page 147 Refer to the graph of y = f (x) shown. Sketch the graph of the new function. 37.
Homework, Page 147 Transform the given function by (a) vertical stretch by a factor of 2 and (b) a horizontal shrink by a factor of 1/3. 41.
Homework, Page 147 Describe a basic graph and a sequence of transformations that can be used to produce a graph of the given function. 45. If the function f (x) = x2is given a horizontal shrink of 1/3, we get f (x) = (3x)2. If we then apply a vertical translation of –4, we get f (x) = (3x)2 – 4.
Homework, Page 147 A graph G is obtained from a graph of y by the sequence of transformations indicated. Write an equation whose graph is G. 49.
Homework, Page 147 Refer to the function f (x) whose graph is shown. 53.
Homework, Page 147 57. The graph shows the temperature (ºC) for one day. Describe the transformation to convert this graph to one showing degrees Fahrenheit. The graph would have a vertical stretch of 9/5 and vertical translation of positive 32.
Homework, Page 147 61. Given a function f, which of the following represents a vertical stretch by a factor of three. a. b. c. d. e.
Homework, Page 147 65. The table shows the price of Dell stock for the first eight months of 2004.
Homework, Page 147 65. a. Graph price (y) as a function of month (x) as a line graph, connecting the points to make a continuous graph.
Homework, Page 147 65. b. Explain what transformation you would apply to this graph to produce a graph showing the price of the stock in Japanese yen. The graph would need to be stretched vertically by a factor of about 120, the approximate number of yen in one dollar.
1.7 Modeling with Functions
What you’ll learn about • Functions from Formulas • Functions from Graphs • Functions from Verbal Descriptions • Functions from Data … and why Using a function to model a variable under observation in terms of another variable often allows one to make predictions in practical situations, such as predicting the future growth of a business based on data.
Example Finding the Model and Solving Grain is leaking through a hole in a storage bin at a constant rate of 5 cubic inches per minute. The grain forms a cone-shaped pile on the ground below. As it grows, the height of the cone always remains equal to its radius. If the cone is one foot tall now, how tall will it be in one hour?
Constructing a Function from Data Given a set of data points of the form (x, y), to construct a formula that approximates y as a function of x: • Make a scatter plot of the data points. The points do not need to pass the vertical line test. • Determine from the shape of the plot whether the points seem to follow the graph of a familiar type of function (line, parabola, cubic, sine curve, etc.). • Transform a basic function of that type to fit the points as closely as possible.
Models from Data The table shows low and high temperatures in 20 cities. Find a function that relates temperatures and predict the high for a low of 46.
Models from Data Find a function that relates temperatures and predict the high for a low of 46.
Homework • Review Section 1.7 • Page 160, Exercises: 1 – 49 (EOO) • Quiz next time