Download
1 / 51
510 likes | 796 Views
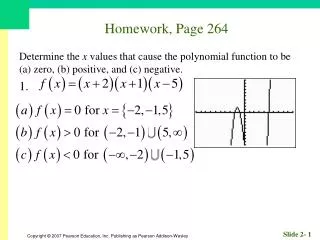
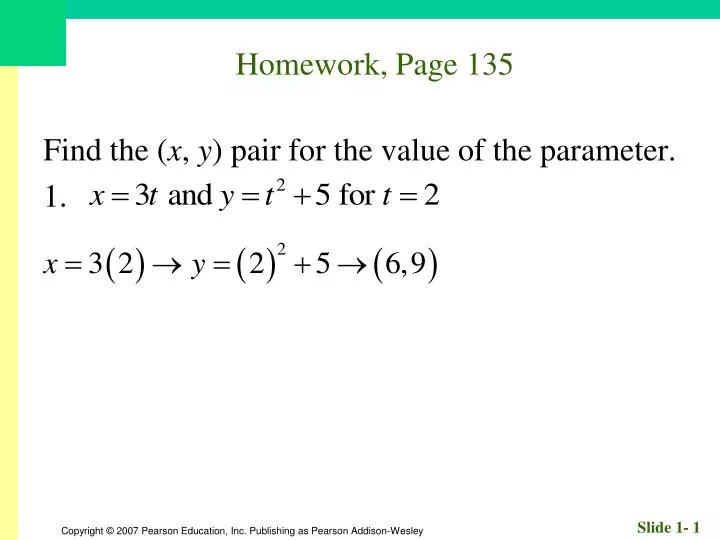
Homework, Page 135. Find the ( x , y ) pair for the value of the parameter. 1. Homework, Page 135. Find the ( x , y ) pair for the value of the parameter. 3. Homework, Page 135. a. Find the points determined by t = –3, –2, –1, 0, 1, 2, 3.

E N D
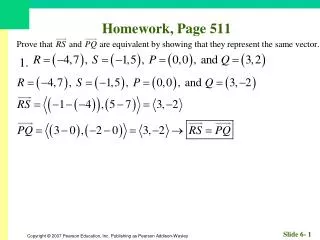
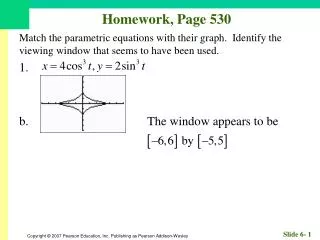
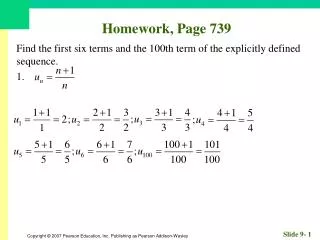
Homework, Page 135 Find the (x, y) pair for the value of the parameter. 1.
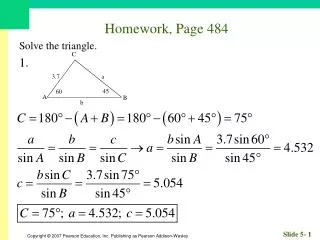
Homework, Page 135 Find the (x, y) pair for the value of the parameter. 3.
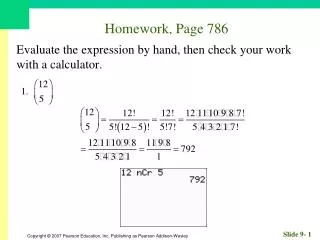
Homework, Page 135 a. Find the points determined by t = –3, –2, –1, 0, 1, 2, 3. b. Find a direct algebraic relationship between x and y and determine whether the parametric equations determine y as a function of x. c. Graph the relationship in the xy-plane. 5.
Homework, Page 135 5. a. Find the points determined by t = –3, –3, –1, 0, 1, 2, 3.
Homework, Page 135 5. b. Find a direct algebraic relationship between x and y and determine whether the parametric equations determine y as a function of x. The relation yields y as a function of x, as the relation passes the vertical line test.
Homework, Page 135 5. c. Graph the relationship in the xy-plane.
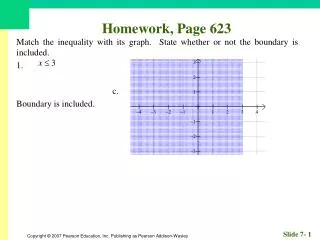
Homework, Page 135 The graph of a relation is shown. a. Is the relation a function? b. Does the relation have an inverse that is a function? 9. a. The relation is not a function. b. The relation has an inverse that is a function.
Homework, Page 135 Find a formula for f–1(x). Give the domain of f–1, including any restrictions ‘inherited’ from f. 13.
Homework, Page 135 Find a formula for f–1(x). Give the domain of f–1, including any restrictions ‘inherited’ from f. 17.
Homework, Page 135 Find a formula for f–1(x). Give the domain of f–1, including any restrictions ‘inherited’ from f. 21.
Homework, Page 135 Determine if the function is one-to-one. If it is, sketch the graph of the inverse. 25. The function is one- to-one, and the inverse function graphs as shown, as a reflection of the function about y = x .
Homework, Page 135 Confirm that f and g are inverses by showing that 29.
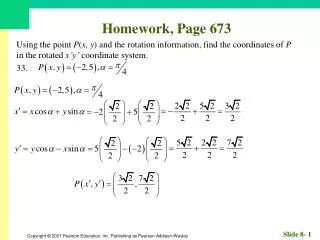
Homework, Page 135 33. In May 2002, the exchange rate for converting U.S. dollars (x) into euros (y) was y = 1.08x. a. How many euros could you get for $100 U.S? b. What is the inverse function and what conversion does it represent? c. In the spring of 2002, a tourist had an elegant lunch in Provence, France ordering from a “fixed price” 48-euro menu. How much was that in U.S. dollars?
Homework, Page 135 33. a. How many euros could you get for $100 U.S? b. What is the inverse function and what conversion does it represent? The inverse function represents the exchange rate for converting euros (x) into U.S. dollars (y).
Homework, Page 135 33. c. In the spring of 2002, a tourist had an elegant lunch in Provence, France ordering from a “fixed price” 48-euro menu. How much was that in U.S. dollars?
Homework, Page 135 37. Which basic function can be defined parametrically as follows?
Homework, Page 135 41. Which ordered pair is in the inverse of the relation given by ? A. (2, 1) B. (–2, 1) C. (–1, 2) D. (2, –1) E. (1, –2)
Homework, Page 135 49. A baseball that leaves the bat at an angle of 60º above the horizontal with a speed of 110 ft/sec may be modeled by the following parametric equations: a. Graph the function per the instructions. Does the ball clear the fence? b. Does the ball clear the fence at 30º? c. What angle is optimum for hitting the ball? Does it clear the fence when hit at that angle?
Homework, Page 135 49. a. Graph the function per the instructions. Does the ball clear the fence? The ball does not clear the fence.
Homework, Page 135 49. b. Does the ball clear the fence at 30º? The ball does not clear the fence at 30º; it barely reaches it.
Homework, Page 135 49. c. What angle is optimum for hitting the ball? Does it clear the fence when hit at that angle? The optimum angle for hitting the ball is 45º, and the ball does clear the fence when hit at this angle.
1.6 Graphical Transformations
What you’ll learn about • Transformations • Vertical and Horizontal Translations • Reflections Across Axes • Vertical and Horizontal Stretches and Shrinks • Combining Transformations … and why Studying transformations will help you to understand the relationships between graphs that have similarities but are not the same.
Transformations Rigid transformation – an action that changes a graph in a predictable manner. The shape and the size of the graph remain unchanged, but its position changes horizontally, vertically or diagonally. Non-rigid transformation – generally a distortion of the shape of a graph, including horizontal or vertical stretches and shrinks
Translations Let c be a positive real number. Then the following transformations result in translations of the graph of y=f(x). Horizontal Translations y=f(x–c) a translation to the right by c units y=f(x+c) a translation to the left by c units Vertical Translations y=f(x)+c a translation up by c units y=f(x)–c a translation down by c units
Reflections The following transformations result in reflections of the graph of y = f(x): Across the x-axis y = – f(x) Across the y-axis y = f(– x)
Graphing Absolute Value Compositions Given the graph of y = f(x), the graph y = |f(x)| can be obtained by reflecting the portion of the graph below the x-axis across the x-axis, leaving the portion above the x-axis unchanged; the graph of y = f(|x|) can be obtained by replacing the portion of the graph to the left of the y-axis by a reflection of the portion to the right of the y-axis across the y-axis, leaving the portion to the right of the y-axis unchanged. (The result will show even symmetry.)
Compositions With Absolute Value Match the compositions of y = f(x) with the graphs. 1. 2. 3. 4. a. b. c. d. e. f.
Stretches and Shrinks Let c be a positive real number. Then the following transformations result in stretches or shrinks of the graph y = f(x). Horizontal Stretches or Shrinks Vertical Stretches and Shrinks
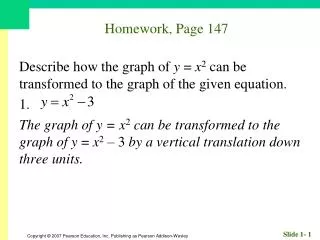
Homework • Review Section 1.6 • Page 147, Exercises: 1 – 65 (EOO)
1.7 Modeling with Functions
What you’ll learn about • Functions from Formulas • Functions from Graphs • Functions from Verbal Descriptions • Functions from Data … and why Using a function to model a variable under observation in terms of another variable often allows one to make predictions in practical situations, such as predicting the future growth of a business based on data.
Example Finding the Model and Solving Grain is leaking through a hole in a storage bin at a constant rate of 5 cubic inches per minute. The grain forms a cone-shaped pile on the ground below. As it grows, the height of the cone always remains equal to its radius. If the cone is one foot tall now, how tall will it be in one hour?
Constructing a Function from Data Given a set of data points of the form (x,y), to construct a formula that approximates y as a function of x: • Make a scatter plot of the data points. The points do not need to pass the vertical line test. • Determine from the shape of the plot whether the points seem to follow the graph of a familiar type of function (line, parabola, cubic, sine curve, etc.). • Transform a basic function of that type to fit the points as closely as possible.
Models from Data The table shows low and high temperatures in 20 cities. Find a function that relates temperatures and predict the high for a low of 46.
Models from Data Find a function that relates temperatures and predict the high for a low of 46.