Download
1 / 24
240 likes | 372 Views
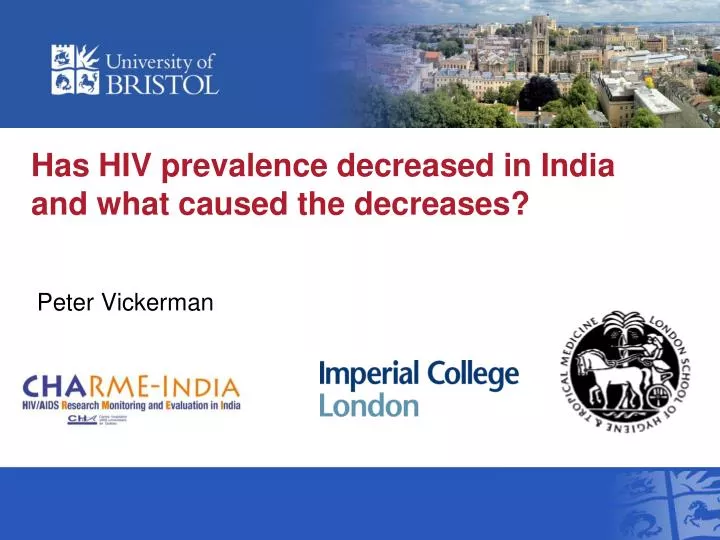
Has HIV prevalence decreased in India and what caused the decreases?. Peter Vickerman. Has HIV prevalence decreased?. Indian sentinel surveillance. Suggests decline in HIV prevalence in all groups for 2003 to 2010 1 : Similar relative declines in FSW, MSM and ANC, BUT smaller in IDU

E N D
Has HIV prevalence decreased in India and what caused the decreases? Peter Vickerman
Indian sentinel surveillance • Suggests decline in HIV prevalence in all groups for 2003 to 20101: • Similar relative declines in FSW, MSM and ANC, BUT smaller in IDU • Used to produce modelled estimates – suggests ↓ by third from 2000-112 • These estimates average trends over contrasting states: • How do trends vary at the state level? 1. HIV sentinel surveillance 2010-11: a technical brief 2. Technical report India HIV estimates 2012
Change in HIV prevalence at state level highly correlated to baseline HIV prevalence • All high prevalence states have decreased BUT some low prevalence states have increased • Larger decreases in states with higher HIV prevalence in 2003: • Epidemic stage may be playing a role? ANC HIV prevalence FSW HIV prevalence
Why has HIV prevalence decreased? • Number of analyses have explored why HIV prevalence has declined in FSW and ANC or general population: • Statistical analyses to determine if related to intervention parameters for key populations • Model analyses
Analysis 1: Decreases in FSW HIV prevalence • Cluster randomised sampling in 24 districts in 4 southern states: 2 to 3 rounds of IBBA from 2004 to 20091 • FSW HIV prevalence declined in districts related to program coverage1 • Also large increases in condom use and intervention outcomes over these periods, with condom use related to program exposure2 1. Alary STD 2014 2. Deering BMC PH 2011
Analysis 2: Ng Lancet 2011 • Considered whether the decline in ANC HIV prevalence in a district is related to intervention investment (per HIV infected) for key populations • Found negative association –greater declines in HIV prevalence if more investment in key population interventions • Did not consider possible causal pathway
Analysis 3: Banandur, JAIDS 2013 • Did not consider possible causal pathway • Considered whether decline in ANC HIV prevalence for young women (<25 years – incidence proxy) is related to being in a high intensity ‘Avahan’ intervention district for key populations • Found negative association – Higher intervention intensity Avahan districts observed greater declines in HIV prevalence, 2003-2008 • However, decline in HIV prevalence also in ‘control’ non-Avahan districts and decline catches up
Analysis 4. Arora BMJ Open 2013 • Considered if coverage of or spending on FSW interventions is related to HIV and Syphilis prevalence in young ANC women (<25 years) • Only number of STIs treated in FSWs is related to HIV prevalence in ANC women but all attributes are related to syphilis risk for ANC women • Although effects not so strong for HIV, they do consider one step further along causal pathway and all interventions (not just Avahan)
Modelling evidence – collection of analyses • HIV transmission shown to be driven by FSWs in India1 • Modelling within a Bayesian framework showed declines in HIV prevalence amongst FSWs can not be explained by natural HIV dynamics, but are likely due to ‘additional’ increases in condom use amongst FSWs2,3 • These models predict substantial (42%) decrease in HIV transmission in whole population2,3 and, • Prevalence declines in general population consistent with ANC trends1 Vickerman AIDS 2010 Boily AIDS 2013 Pickles LGH 2013
Modelling evidence Vickerman AIDS 2010 Boily AIDS 2013 Pickles LGH 2013 • HIV transmission is driven by FSWs in India1 • Modelling within a Bayesian framework showed declines in HIV prevalence amongst FSWs can not be explained by natural HIV dynamics, but are likely due to ‘extra’ increases in condom use amongst FSWs2,3 • These models predict substantial decrease in HIV transmission in whole population2,3 and, • Prevalence declines in general population consistent with ANC trends1 Mysore Belgaum
Discussion • Evidence suggests HIV prevalence has decreased in most states and population sub-groups • Statistical analyses suggest some of these declines may be due to scale up of key population targeted interventions • Although prevalence may have been decreasing anyway • Modelling suggests HIV transmission is driven by FSW and that recent scale up of FSW/MSM targeted interventions has decreased overall HIV transmission. • Limitations: 1. Most evidence is based on Avahan districts in 4 southern states; 2. Lack of understanding why some states have increasing prevalence
Centre hospitalier affilié universitaire de Québec (Laval University): lead institution: direction and coordination Michel Alary (principal investigator) Imperial College of Science, Technology and Medicine Marie-Claude Boily Mike Pickles Anna Phillips SharmisthaMisra London School of Hygiene and Tropical Medicine Anna Vassall SudhaChandrashekar Charlotte Watts Mike Pickles Kate Mitchell University of Manitoba / Karnataka Health Promotion Trust Stephen Moses; James Blanchard; B.M. Ramesh; Reynold Washington; SushenaReza Paul; ShajyIsac; Jan Bradley Field data collection; project infrastructure in India INDIAN PARTNERS AND COLLABORATING INSTITUTIONS St John’s Medical College (IPHCR), Bangalore Tata Institute of Social Sciences, Mumbai Academic Staff College of India, Hyderabad Centre for Media Studies, Hyderabad University of British Columbia Kathleen Deering Dept. HIV&STIs, PHE, London, UK Catherine Lowndes University of Montreal Annie-Claude Labbé Rest of the CHARME Team
What does the data suggest- sentinel surveillance data • Main data used to obtain trends in HIV prevalence How collected: • ANC: Women consecutively sampled – 400 in each clinic • STD clinic attendees are consecutively sampled amongst those with STD syndromes– 250 from each site • High-risk groups sampled from service points (de-addiction center, drop-in centers, clinics) – 250 at each • Testing is anonymous, unlinked and quality assurance is undertaken HIV sentinel surveillance operational guidelines
How has the sentinel sites scaled up • Number of ANC sites scaled up massively until 2006 but then remained stable till 2011 (506 urban and 182 rural) • Number of HRG sites very low before 2003, and still increasing – IDU (79), FSW (261), MSM (96) in 2011 • Over 250,000 ANC women and 100,000 HRG tested Annual HIV sentinel surveillance country report 2006
Impact evaluation Avahan AIM: “To slow rate of HIV transmission to general population by raising coverage of targeted interventions across large areas.” Bridging infections Bridging infections High-risk groups General population General population Targeted interventions • -Use mathematical modelling within a Bayesian framework to examine whether trends in HIV prevalence in different high risk groups: • Could be due to natural disease dynamics and pre-existing interventions? • OR are the trends more likely due to the possible increases in condom use after Avahan intervention. • Estimate impact associated with increases in condom use that account for parameter uncertainty • Can increases in condom use be attributed to Avahan
ANC HIV prevalence at state level 2004-2011 • HIV prevalence decreased at national level and in high prevalence (HP) states and some low prevalence (LP) states, BUT • Stable or slowly rising in other LP states • Number of ANC sites with HIV prevalence>1%: • ↓135 to 65 in HP states, • ↑ 8 to 24 in LP states • Similar trends for FSW and MSM, BUT IDU stable or slowly increasing HIV sentinel surveillance 2010-11: a technical brief
Modelled estimates using methods recommended by UNAIDS/WHO Global Reference Group on Estimations, Projections and Modelling • Based on the spectrum model involving the estimation and projection package using • Epidemiological data from 12 rounds of HIV sentinel surveillance (ANC, FSW, MSM and IDU) for 1998-2011, IBBA and size estimations • Curves produced for 34 states for each risk group • Suggests HIV prevalence in India has decreased by a third from 0.40% to 0.27% during 2000 to 2011 Technical report India HIV estimates 2012
ANC HIV prevalence trends at state level Stable or increasing in moderate HIV prevalence states Decreasing in high prevalence states Increasing in some low prevalence states HIV sentinel surveillance 2010-11: a technical brief
Where has HIV decreased or increased ANC 2006 ANC 2011
FSW HIV prevalence trends at state level Increasing or stable in low HIV prevalence states Decreasing or stable in high prevalence states • Similar trends found for MSM • For IDU trends less clear with trends generally being stable or increasing HIV sentinel surveillance 2010-11: a technical brief