Download
1 / 3
30 likes | 130 Views
Figure S1. B. A. Logrank p<0.0001. Logrank p=0.0001. Week 3-5 Median OS CEA ( ng /mL) N (%) Months (95% C.I.) CEA < 25 47 (41%) 24.9 (20.5 – NR) CEA > 25 68 (59%) 12.5 ( 9.4 – 16.2).

E N D
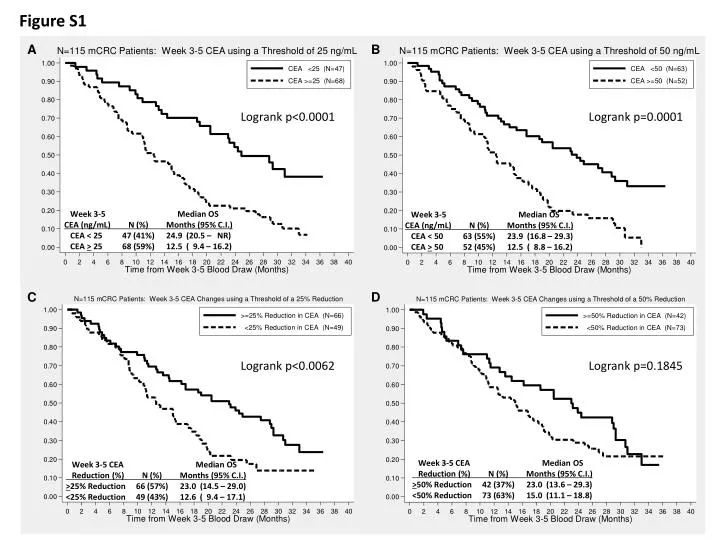
Figure S1 B A Logrank p<0.0001 Logrank p=0.0001 Week 3-5 Median OS CEA (ng/mL) N (%) Months (95% C.I.) CEA < 25 47 (41%) 24.9 (20.5 – NR) CEA > 25 68 (59%) 12.5 ( 9.4 – 16.2) Week 3-5 Median OS CEA (ng/mL) N (%) Months (95% C.I.) CEA < 50 63 (55%) 23.9 (16.8 – 29.3) CEA > 50 52 (45%) 12.5 ( 8.8 – 16.2) D C Logrank p<0.0062 Logrank p=0.1845 Week 3-5 CEA Median OS Reduction (%) N (%) Months (95% C.I.) >50% Reduction 42 (37%) 23.0 (13.6 – 29.3) <50% Reduction 73 (63%) 15.0 (11.1 – 18.8) Week 3-5 CEA Median OS Reduction (%) N (%) Months (95% C.I.) >25% Reduction 66 (57%) 23.0 (14.5 – 29.0) <25% Reduction 49 (43%) 12.6 ( 9.4 – 17.1)
Figure S2 B A
Figure S2 D C