Download
1 / 32
320 likes | 530 Views
Doğu Akdeniz Üniversitesi. Faculty of Business and Economics Department of Banking and Finance. Markets Technical Analysis and Algorithmic Trading Chapter 2: Constructing charts. Saeed Ebrahimijam Fall 2013-2014 . FINA417. Contents. Types of charts - Line charts - Bar charts

E N D
DoğuAkdenizÜniversitesi Faculty of Business and Economics Department of Banking and Finance Markets Technical AnalysisandAlgorithmic TradingChapter 2: Constructing charts SaeedEbrahimijam Fall 2013-2014 FINA417
Contents • Types of charts - Line charts - Bar charts - Japanese Candlestick charting • Arithmetic Versus Logarithmic Scale • Volume Fundamental of Technical Analysis and Algorithmic Trading
A chart is like a cat’s whiskers. A cat’s whiskers tell the cat which way the mouse will turn and thus which way to pounce. The mouse doesn’t think about which way it will turn, but the cat must anticipate that direction. Likewise, the market doesn’t know which way it will turn, but the speculator must anticipate that turn regardless. He uses a chart as his whiskers. (SiekiShimizu, 1986) • Charts say us what the stock is really doing in the market. • Whether it is good time to enter the market? • Charts are faster!! Fundamental of Technical Analysis and Algorithmic Trading
Line charts Stock Price Time Fundamental of Technical Analysis and Algorithmic Trading
Line charts • line charts are especially useful when studying long-term trends • Journalists often use line charts to give the reader a quick, concise picture of the variables being discussed. Fundamental of Technical Analysis and Algorithmic Trading
Bar charts • Each bar is composed of 4 elements: • Open: the price of the stock when it opens in the beginning of the specific trading period. • High : the highest price of the stock in the specific trading period. • Low : the lowest price of the stock in the specific trading period. • Close: the price of the stock, at the end ofthe specific trading period. Fundamental of Technical Analysis and Algorithmic Trading
A sample of Bar chart Fundamental of Technical Analysis and Algorithmic Trading
Japanese Candlestick chart • One Candle stick for each period of time. 1 min, 15 min, 1Hour, daily, weekly, monthly… Doji star Japanese Candlestick Charting Techniques by Steve Nison in 1991 were Western traders introduced to candlestick charts. Fundamental of Technical Analysis and Algorithmic Trading
A sample of Candlestick chart Fundamental of Technical Analysis and Algorithmic Trading
There have been few tests on the effectiveness of candlestick patterns. • Measuring the effectiveness of patterns over weeks or months is useless because these patterns are only useful in short-term situations. Fundamental of Technical Analysis and Algorithmic Trading
Types of candlesticks 1- too much Bearish 2- too much Bullish 3- Bearish 4- Bearish 5- Bullish 6- Bullish 7- Neutral 8- Neutral 9- Bullish in the downtrend, Bearish in the uptrend 10- Bullish in the downtrend, Bearish in the uptrend 11- A turning period 12- A turning period 13- End of downtrend 14- A turning period 15- (possible) turning period Fundamental of Technical Analysis and Algorithmic Trading
Candlesticks Bullish Reversal Patterns • Hammer • Bullish engulfing pattern • Tweezer bottom • Piercing line • Morning star • Bullish doji star • Bullish harami • Bullish harami cross • Bullish meeting lines Fundamental of Technical Analysis and Algorithmic Trading
Candlesticks Bearish Reversal Patterns • Hanging man • Bearish engulfing pattern • Tweezer top • Dark cloud cover • Upside gap two crows • Evening star • Bearish doji star • Shooting star • Bearish harami • Bearish harami cross • Bearish meeting lines Fundamental of Technical Analysis and Algorithmic Trading
Candlesticks Continuation Patterns • Window • Upside tasuki gap • Rising three methods • Falling three methods • Side-by-side white lines Fundamental of Technical Analysis and Algorithmic Trading
Hammer • In a period of time the prices fall down, but at the end of the period prices rises rapidly and close price is near the open price. • The length of down shadow should at least equal to double of candle body. Fundamental of Technical Analysis and Algorithmic Trading
Bullish Engulfing Pattern • The size of the black candlestick isn’t that important. The second candlestick, however, should be a long white candlestick which should totally engulf the body of the first black candlestick. • The wider the price range on the up day, and the heavier the trading volume, the more bullish it becomes. The “upside reversal day” takes place when a market opens lower and closes higher the day after a market decline. Fundamental of Technical Analysis and Algorithmic Trading
Bullish Tweezer bottom Fundamental of Technical Analysis and Algorithmic Trading
Bullish Piercing Line Note: Fundamental of Technical Analysis and Algorithmic Trading
Morning Star (Bullish) • develops over three periods. - In the first period, prices close lower than they were when they opened, resulting in a black main body. - In the second period, prices open lower creating a downside gap and close higher after trading in a relatively narrow range (a small main body). - In the third period, prices continue to move higher and close above the midpoint of the first period’s black main body. Fundamental of Technical Analysis and Algorithmic Trading
Bullish Doji Star Fundamental of Technical Analysis and Algorithmic Trading
Bullish Harami Note: Fundamental of Technical Analysis and Algorithmic Trading
Evening Star (Bearish) • They are reversal patterns that can be recognized through these three characteristics: - The first stick is a bullish candle, which is part of a recent uptrend. - The second candle has a small body, indicating that there could be some indecision in the market. This candle can be either bullish or bearish. - The third candle acts as a confirmation that a reversal is in place, as the candle closes beyond the midpoint of the first candle. Note: Fundamental of Technical Analysis and Algorithmic Trading
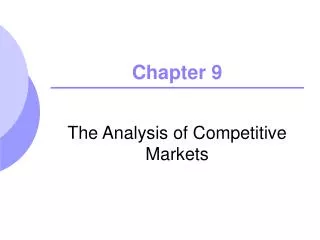
Arithmetic vs. logarithmic scale • On an arithmetic scale, an equal distance for each price unit of change is shown on the vertical scale. Thus the distance between 10 and 20 on the vertical scale equals the distance between 20 and 30, 30 and 40, and so on. On a logarithmic scale, the distance between each price unit of change represents an equal percentage of change. For example, the difference between 10 and 20 and 40 and 80 is the same because each represents a 100 percent increase. Fundamental of Technical Analysis and Algorithmic Trading
The rule of thumb for when to use an arithmetic or logarithmic scale • when the security's price range over the period being investigated is greater than 20% ,a logarithmic scale is more accurate and useful. As a rule, the truly long-term charts (more than a few years) should always be plotted on logarithmic scales. Fundamental of Technical Analysis and Algorithmic Trading
Arithmetic Vs. Logarithmic Fundamental of Technical Analysis and Algorithmic Trading
Volume • The trade volume is commonly mentioned at the bottom of the charts according to the period of required period of time. • Increase and decrease in the volume will take into consideration in predicting and analysis of price volatility. • In a healthy uptrend, volume bars are generally larger when prices are rising and smaller when prices are falling. In other words, volume is confirming the price trend. Fundamental of Technical Analysis and Algorithmic Trading
As a general rule of thumb: • “heavier volume should be evident in the direction of the existing trend.” Fundamental of Technical Analysis and Algorithmic Trading
It’s generally a good sign when a price rise is confirmed by rising volume as was the case with Barrick Gold at the start of 2008. Heavy downside volume during March 2008, however, warned of a downside correction. Source: StockCharts.com Fundamental of Technical Analysis and Algorithmic Trading
Open Interest • Open interest has a different meaning in the stockmarket than in the options and futures markets, but in both cases, it gives traders useful information about demand: • In the stock market, open interest is the number of buy orders submitted before the market opens. When the open interest is high, people are ready to add shares to their positions or initiate new positions, which means that the stock is likely to go up in price. • In the options and futures markets, open interest is the number of contracts at the end of every day that have not been exercised, closed out, or allowed to expire. • Day traders don’t have open interest, because by definition, day traders close out at the end of every day. But some traders keep open interest, either because they think that their position has the ability to increase in profitability or because they’re hedging another transaction and need to keep that options or futures position in place. • If open interest in a contract is increasing, new money is coming into the market, and prices are likely to continue to go up. This is especially true if volume is increasing at about the same rate as open interest. On the other hand, if open interest is falling, people are closing out their positions because they no longer see a profit potential, and prices are likely to fall. Fundamental of Technical Analysis and Algorithmic Trading