Download
1 / 8
370 likes | 2.3k Views
MILESTONE TREND ANALYSIS CHARTS Visualizing a Project’s Progress and Planning. Tom Lindstrom TL TooLs, Inc. TL@TLTooLs.net 847-525-2090. Project Milestones and MTA Charts. Project Milestones with specific completion criteria provides: an indication of the project’s progress

E N D
MILESTONE TREND ANALYSISCHARTSVisualizing a Project’s Progress and Planning Tom Lindstrom TL TooLs, Inc. TL@TLTooLs.net 847-525-2090
Project Milestones and MTA Charts • Project Milestones with specific completion criteria provides: • an indication of the project’s progress • a method to coordinate dependent tasks • assurance that artifacts, required by the project, have been produced • Often associated with a formal decision whether to fund next project phase • Tracking the changes to milestone planning during the project provides: • historical perspective when evaluating the current project status • insight on the accuracy of the project’s planning • insight on the volatility of the project’s scope • insight on the risk to the project schedule and product quality • a historical record available for the project’s post mortem • a historical record available for the planning of future projects • MTA Charts: • display the past and current planning for past and future project milestones • graph the milestone planning history graphically; providing easier analysis
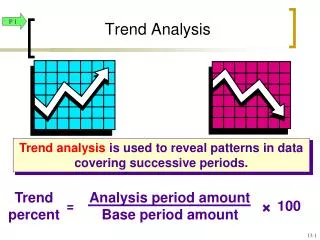
Chart from 7/14/2006 • A plotted line shows a milestone’s historical planning. • The X axis indicates the milestone’s planning date. • The Y axis indicates the planned milestone date. • A milestone has occurred when the milestone’s line reaches the Milestone Reached line. • The lower right half of the chart can be used to document the cause for adjustments to milestones. • Milestone is delayed an additional week every week. Adjusted to support approved requirements (“Xyz” functionality). Incorporated new “Xyz” functionality with no delay.
Chart from 11/10/2006 • Milestones can be added at any time. Added system integration milestone. • The “Design Done” line passes through the “Milestone Reached” line indicating the milestone planning was not adjusted to reflect the late finish of the design. Engineering has not provided a new date. Adjusted to support approved requirements (“Xyz” functionality). Incorporated new “Xyz” functionality with no delay.
Chart from 1/19/2007 • Milestones not extending to the current date indicate a cancelled milestone. Implementation of the “QRS” subsystem delayed due to resources being reassigned. Added system integration milestone. Engineering has not provided a new date. Adjusted to support approved requirements (“Xyz” functionality). Incorporated new “Xyz” functionality with no delay.
Final Project Chart Test 3 required to fix critical defect. More than expected integration defects found. Implementation of the “NOP” subsystem delayed due to resources reassigned. Added system integration milestone. Engineering has not provided a new date. Adjusted to support approved requirements (“Xyz” functionality). Incorporated new “Xyz” functionality with no delay.
Creating MTA Chart using an Excel Line Chart • An Excel drawing object is used to coverthe grid in the lower right half of the chart. • The “Milestone Reached” indicator is created using a plotted series in the chart.
Visualizing a Project’s Progress and Planning Tom Lindstrom TL TooLs, Inc. TL@TLTooLs.net 847-525-2090