Download
1 / 33
330 likes | 467 Views
C ompartmentalized S hotgun A ssembly. ?. ?. ?. CSA Two stated motivations?. ?. Matcher matched…. …matched Celera reads with PFP BACTIGS , 20.76 million Celera reads matched (76%), 0.62 million had a mate pair that matched, 2.97 million Celera reads were unique and un-screened,

E N D
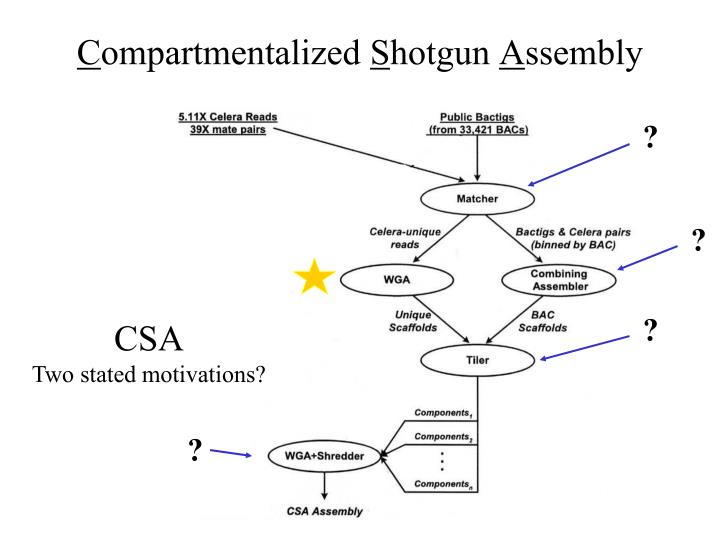
Compartmentalized Shotgun Assembly ? ? ? CSA Two stated motivations? ?
Matcher matched… …matched Celera reads with PFP BACTIGS, • 20.76 million Celera reads matched (76%), • 0.62 million had a mate pair that matched, • 2.97 million Celera reads were unique and un-screened, • 1.189 Gbp of unique DNA sequence, at 5.11X yields a predicted 240 Mbp of unique Celera sequence.
Combining Assembler assembles…“…Celera and PFP sequence for a transient assembly” …first, Celera reads, • are checked for over-collapsed regions, • sequences with Mate Pairs that match region are kept, • more mate pair matches = higher value assembly, …then Celera reads are combined with PFP reads, • “Greedy” program recognizes highest value assemblies first in order to build contigged sequence, …then “Stones” to fill the gaps.
Results…PFP vs. CSA • The GenBank (PFP) data for the Phase 1 and 2 BACs yielded an average of 19.8 bactigs per BAC, of average size 8099 bp, • Application of the Combining Assembler resulted in individual Celera/BAC assemblies being put together into an average of 1.83 scaffolds (median of 1 scaffold) per BAC region consisting of an average of 8.57 contigs of average size 18,973 bp. pp. 1313, 1st column, last paragraph
Celera Unique ScaffoldsWGA • The 5.89 million Celera fragments not matching the GenBank data were assembled with the whole-genome assembler. • The Celera assembly resulted in a set of scaffolds totaling 442 Mbp in span and consisting of 326 Mbp of sequence. More than 20% of the scaffolds were >5 kbp long, and these averaged 63% sequence and 27% gaps with a total of 302 Mbp of sequence.
Tiler tiles… • Scaffolds into larger components using • Mate End Pairs, • BAC-end pairs, • STS, • Heuristic: a rule of thumb, simplification, or educated guess that reduces or limits the search for solutions in domains that are difficult and poorly understood. Unlike algorithms, heuristics do not guarantee optimal (or even feasible) solutions and are often used with no theoretical guarantee.
Compartmentalized Shotgun Assembly • 3,845 Components • shredded, WGA *
93% • > 100 kbp Scaffolds; • 92% sequence, 8% gaps, • 105,264 gaps, 1,935 scaffolds, • 1.3 Mbp scaffold size, 23,242 bp contig size. • > 49% gaps < 500 bp, • > 62% gaps < 1 kb, • No gap larger than 100 kbp.
small regions WGA vs. CSA • This gives some measure of consistent coverage: • 1.982 Gbp (95.00%) of the WGA is covered by the CSA, • 2.169 Gbp (87.69%) of the CSA is covered by the WGA. • Only 31 scaffolds were ~unique to an assembly, • 295 kb (0.012%) CSA inconsistent with WGA, • 2.108 Mb (0.11% WGA inconsistent with CSA, • Overall, CSA slightly better than WGA… • Why? • How does the CSA compare with the Clone-by-Clone approach?
Whole Genome Assembly Hierarchical Clone-by-Clone Map First: then sequence Sequence First: then map
? Tab. 4
CSA 92.2 % Sequence 7.8 % Gaps 116,442 Gaps WGA PFP 91 % Sequence 92.5 % Sequence 9 % Gaps 12.9 % Gaps 102,068 Gaps Small gaps (554 bp) = 145,514 Gaps, Large gaps (35 kb) = 4076 Gaps. Assembly and Validation Analysis…did it really work? • Completeness: % of euchromatic sequence in the assembly, • estimate the size and # of gaps (Table 3),
Assembly and Validation Analysis…did it really work? • Completeness: % of euchromatic sequence in the assembly, • estimate the size and # of gaps (Table 3), • compare to “finished” sequences of 21,22 • 3.4 Mb gaps, 75% gaps are repeats, • match with STS data (ePCR, BLAST), • 93.4% tested found assembled, 5.5% in “chaff” = 98.9%, • Correctness: • Mate-Pair analysis.
Mate Pair Analysis Valid: correct orientation and correct distance + 3 SD 2.7% were found to be invalid.
CSA vs. PFP What does this show?
Blue: Gaps Violations: Red : misoriented Yellow: distance PFP CSA Green: Same Order, Orientation Chromosome 21 Yellow: Same Orientation Red: Out of Order, Orientation
PFP CSA Chromosome 8
PFP CSA
Blue: breaks Red: gaps > 10kb PFP CSA Fig. 7, key
Gene Prediction and AnnotationWhy’s it So Hard to Find Genes? • Exons/Introns, • Alternative Splicing/Termination, • Alternate transcription start/stop sites, • Tandem Repeats, Psuedogenes, etc. • We don’t really understand all there is to know about gene and genome structure, • etc.
Gene Number Predictions?…before PFP, WGA or CSA Textbooks: ~100,000 Upgraded to 142,634? EST data “…counts [that] fall far short…” EST Data --> 35,000 35,000 genes based on the density of Chromosome 22 28, 000 - 34,000 Humans vs. pufferfish
Automated Gene AnnotationOTTO Tell me how it works. How was it validated, including Table 7. • …if necessary, use the Online Primer and other NCBI resources to broaden your understanding, • cDNAs, ESTs, RefSeq, Protein Sequence Databases, BLAST, etc. are described in appropriate detail on the WEB.
Repeat Resolver...most of the remaining gaps were due to repeats. • “Rocks” • Use “low Discriminator Value” contig sets to fill gaps, • - find two or more mate pairs with unambiguous matches in the scaffold near the gap (2 kb, 10kb or 50 kb), (1 in 107), • “Stones” • - find mate pair matches 2 kb, 10 kb, and 50 kb from gap, place the mate in the gap, check to see if it’s consistent with other “placed” sequences.
Repeat Resolver...most of the remaining gaps were due to repeats. • “Rocks” • Use “low Discriminator Value” contig sets to fill gaps, • - find two or more mate pairs with unambiguous matches in the scaffold near the gap (2 kb, 10kb or 50 kb), (1 in 107), • “Stones” • - find mate pair matches 2 kb, 10 kb, and 50 kb from gap, place the mate in the gap, check to see if it’s consistent with other “placed” sequences.