Download
1 / 24
240 likes | 331 Views
Overview of error model for estimates of foreign-born immigration using data from the American Community Survey. Mary H. Mulry U.S. Census Bureau 2011 International Total Survey Error Workshop June 21, 2011. Background.

E N D
Overview of error model for estimates of foreign-born immigration using data from the American Community Survey Mary H. Mulry U.S. Census Bureau 2011 International Total Survey Error Workshop June 21, 2011
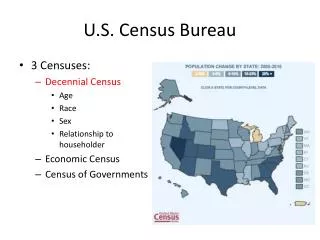
Background • Two programs use estimates of foreign-born immigration based on data from the American Community Survey (ACS) • Demographic Analysis estimates of the U.S. population on April 1, 2010 included estimates of foreign-born immigration each year between 2000 & 2010 • Population Estimates Program (PEP) estimates of the U.S. population on July 1 each year include estimates of foreign-born immigration in previous year. • Main estimation method for foreign-born immigration uses the responses to two ACS questions • citizenship • residence one year ago (ROYA)
Goal • Describe the uncertainty in the estimates of foreign-born immigration • Design an error model that accounts for sampling and nonsampling errors • Propose reasonable estimates based on studies of nonsampling errors in ACS for other purposes or studies of nonsampling errors in other surveys • Time limitations prevent us from conducting studies to measure ACS nonsampling errors
Strategy • Use the error model in the design of a simulation to study the propagation of errors • Results of simulation study will produce sensitivity analyses that assess the uncertainty in estimates of foreign-born immigration
ACS Question 8 • “Is this person a CITIZEN of the United States?” • Yes, U.S. citizen by naturalization – Print year of naturalization • ____________ • No, not a U.S citizen Native Foreign born
ACS Question 15a • “Did this person live in this house or apartment 1 year ago?” • No, outside the United States and Puerto Rico – Print name of foreign country, or U.S. Virgin Islands, Guam, etc. below _____________________
Estimate of foreign-born immigration T : • Notation (within a population control cell) P = size of population F= size of the foreign-born population (Question 8) Y = size of foreign-born population whose residence one year ago was outside the U.S. (Question 14a) • = Postcensal Estimates Program estimate of P • = ACS estimate of proportion of householdpopulation who are foreign-born (F/P) = ACS estimates of proportion of the foreign-born whose residence one year ago was outside the U.S. (Y/F)
Error model for β = bias ε = random error
Model for bias in β = βI + βD • βI= bias from inconsistency in characteristics in ACS and PEP used in forming the control cells • βD= bias from errors in the data occurring during collection and processing
Model for random error in ε = εS +εS εS = the random error due to sampling error εM= the random error due to imputation for missing data
Potential sources of inconsistencies in characteristics in PEP & ACS ( βI) • ACS error in the coding of responses to race/Hispanic ethnicity questions • Changes in reporting of race/Hispanic ethnicity since 2000 • Census 2000 is the base for PEP estimates • Differences between ACS & PEP data sources caused by errors or changes in methodology
Potential sources of data error in the PEP estimates ( βD) • Coverage error in Census 2000 numbers (used as a base) • Error in the data used to form updated population estimates during the decade
Potential sources of data errorin ACS collection (βD) • Frame coverage error • Misclassification: foreign-born vs. native-born • For foreign-born, residence 1 year ago errors • Address errors • wrong address interviewed • other errors: HU vs. not; vacant vs. occupied • Roster errors • omissions & erroneous inclusions
Estimating bias due to ACS data collection error ACS uses 3 modes in a sequence • mail, telephone, in-person May have error estimates by mode only Estimator of bias due to data collection error is weighted sum of estimated biases for modes where weights are weighted proportion of responses by each mode
Potential sources of data errorin ACS processing (βD) • Error in editing • Question 8 (citizenship) • Question 15a (residence 1 year ago) • Error in coding • Question 15a (residence 1 year ago) only • Error in keying • Question 15a (residence 1 year ago) only
Random Error due to imputation(εM) • ACS imputation for missing data uses geography-based hot-deck method • Question 8 (citizenship) • Question 15a (residence 1 year ago)
Random error due to sampling (εS)foreign-born immigration (thousands) Notes: 1) Estimates are 3-year averages before 2005 due to smaller sample size 2) Standard errors calculated with weights prior to population controls
Indicators of General Quality of the ACS • Coverage ratios for total population ACS estimate/PEP estimate • Response rates Accounts for ACS multi-mode collection and selection of sub-sample for last mode
Note: ACS has longer response period and a sequence of 3 modes of collection.
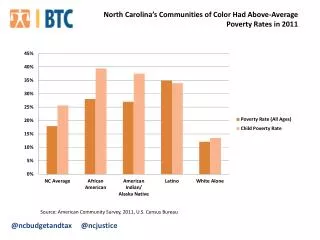
Coverage ratios for ACS • Appear fairly stable • Higher for females than for males • Higher for nonblacks than for blacks • Coverage ratio for Hispanics in 2007 & 2008 was 92.8 and 92.5, respectively
Next steps • Form estimates of the nonsampling errors, their variances, & covariance matrix • Draw replicates from their joint distribution to produce the distribution of foreign-born immigration. • Resulting estimates • bias • random error • Perform sensitivity analyses to aid in determining the most influential error sources
mary.h.mulry@census.gov U.S. Census Bureau