Download
1 / 114
1.15k likes | 1.45k Views
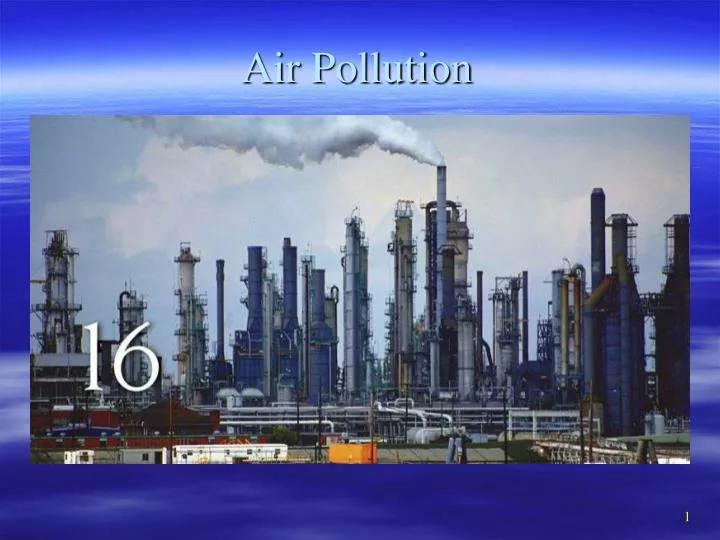
Air Pollution. THE AIR AROUND US. Air pollution-physical or chemical changes brought about by natural processes or human activities that result in the decrease of air quality ~147 million metric tons annually in US Worldwide ~2 billion metric tons.

E N D
THE AIR AROUND US • Air pollution-physical or chemical changes brought about by natural processes or human activities that result in the decrease of air quality • ~147 million metric tons annually in US • Worldwide ~2 billion metric tons. • Improving air quality in developed countries, developing getting worse.
NATURAL SOURCES OF AIR POLLUTION • Natural Fires - Smoke • Volcanoes - Ash and acidic components • Sea Spray - Sulfur • Bacterial Metabolism - Methane • Dust • Pollen
HUMAN-CAUSED AIR POLLUTION • Primary Pollutants – emitted directly into air from a point source • Secondary Pollutants – formed in air when primary pollutants react or interact
Major Sources of Primary Pollutants Stationary Sources • Combustion of fuels for power and heat – Power Plants • Burning wood, crops, and/or forest fires • Industry • Solvents and aerosols Mobile Sources • Highway: cars, trucks, buses and motorcycles • Off-highway: aircraft, boats, locomotives, farm equipment, RVs, construction machinery, and lawn mowers
Major Air Pollutants • Carbon monoxide (CO) • Nitrogen dioxides (NO2) • Ozone (O3) • Particulate matter (PM-10, PM-2.5) • Sulfur dioxide (SO2) • Lead (Pb) • Greenhouse gases (CO2 and others)
Carbon Monoxides • Properties:colorless, odorless, 0.0036% of atmosphere • Effects:reduces ability of blood to bring oxygen to body cells and tissues, mental functions and visual acuity, even at low levels • Sources:incomplete combustion of fossil fuels • 60 - 95% from auto exhaust • 5.5 billion tons enter atmosphere/year
Sulfur Dioxides • Properties: colorless gas with irritating odor • Effects: produces acid rain (H2SO4), breathing difficulties, eutrophication due to sulfate formation • Sources: • Natural: sea spray, volcanic fumes • Human sources: burning high sulfur coal or oil, smelting or metals, paper manufacture
Particulate Matter • Properties: particles suspended in air (<10 um) • Effects: lung damage, mutagenic, carcinogenic, teratogenic, reduces visibility • Sources: • Natural: dust, volcanic ash, pollen, spores • Human sources: Smoke, dust, soot, asbestos, factories, unpaved roads, plowing, lint, burning fields
Particulate Matter • Impacts: Visibility at Shenandoah Nat’l Park Source: Ref. (2)
Nitrogen Oxides • Properties: reddish brown gas, strong oxidizing agent, forms Nitric acid in air • Effects: acid rain, lung and heart problems, decreased visibility (yellow haze), suppresses plant growth • Sources: • Natural: forest fires, volcanoes, lightning, bacteria in soil • Human sources: fossil fuels combustion, power plants,
Lead • Properties: grayish metal • Effects: accumulates in tissue; affects kidneys, liver and nervous system (children most susceptible); mental retardation; possible carcinogen; 20% of inner city kids have [high] • Sources: particulates, smelters, batteries • 2 million tons enter atmosphere/year
Ozone (Ground Level) • Properties: colorless, unpleasant odor, major part of photochemical smog • Effects: lung irritant, damages plants, rubber, fabric, eye, reduces visibility • Sources: Created by sunlight acting on NOx and VOCs NOx + VOCs + sunlight -> NOx + O3 cars, industry, gas vapors, chemical solvents, incomplete fuel combustion products
Ozone (O3) • 10,000 to 15,000 people in US admitted to hospitals each year due to ozone-related illness • Children more susceptible
VOCs • Properties: organic compounds (hydrocarbons) that evaporate easily, usually aromatic • Effects: eye and respiratory irritants; carcinogenic; liver, CNS, or kidney damage; damages plants; lowered visibility due to brown haze; global warming • Sources:vehicles(largest source),evaporation of solvents or fossil fuels, aerosols, paint thinners, dry cleaning • Concentrations indoors up to 1000x outdoors • 600 million tons of CFCs
Formation & Intensity Factors • Local climate (inversions, air pressure, temperature, humidity) • Topography (hills and mountains) • Population density • Amount of industry • Fuels used by population and industry for heating, manufacturing, transportation, power • Weather: rain, snow,wind • Buildings (slow wind speed) • Mass transit used • Economics
Smog Forms ...when polluted air is stagnant (weather conditions, geographic location) Los Angeles, CA
NO3 2 – – SO4 Primary Pollutants CO CO2 Secondary Pollutants SO2 NO NO2 SO3 Most hydrocarbons HNO3 H2SO4 Most suspended particles H2O2 O3 PANs and salts Most Natural Sources Stationary Mobile
Secondary Pollutants HNO3 O3 nitric acid ozone Photochemical Smog Photochemical Smog UV radiation H2O + O2 Primary Pollutants NO2 + Hydrocarbons Auto Emissions
Temperature Inversions • Occurs when a stable layer of warm air overlay cooler air near the ground • Usually happens at night since ground loses heat quickly
Heat Islands • Heat islands-Urban development creates warm, stable air masses over large cities. • Sparse vegetation and dark surfaces • Concentrates pollutants in a “dust dome”. • Rural areas downwind have decreased visibility and increased rainfall.
Acid Deposition • Occurs when sulfur dioxide and nitrogen oxides are emitted into the atmosphere • Coal burning plants • Automobiles • Absorbed by water droplets in clouds
Secondary Pollutants H2SO4 HNO2 sulfuric acid nitric acid Primary Pollutants SO2 NO2 acidic precipitation vegetation direct toxicity indirect health effects water Fossil fuels Power plants Industrial emissions Auto emissions sediments leaching aluminum soils leaching of minerals
2 Forms of Acid Deposition • Wet deposition-acidic rain, fog, snow and cloud vapor • Falls in downward winds areas within 4-14 days • Dry deposition-acidic particles and gases • Falls near the emission sources within 2-3 days
Acidic Precipitation Wind Transformation to sulfuric acid (H2SO4) and nitric acid (HNO3) Windborne ammonia gas and particles of cultivated soil partially neutralize acids and form dry sulfate and nitrate salts Wet acid deposition (droplets of H2SO4 and HNO3 dissolved in rain and snow) Dry acid deposition (sulfur dioxide gas and particles of sulfate and nitrate salts) Sulfur dioxide (SO2) and NO Nitric oxide (NO) Acid fog Farm Lakes in deep soil high in limestone are buffered Lakes in shallow soil low in limestone become acidic Ocean
Factors that effect… • The strength of the effects depend on many factors • How acidic the water is • The chemistry and buffering capacity of the soils involved • The types of fish, trees, and other living things that rely on the water
Effects of Acid Rain • Damages forests and soils, fish and other organisms, materials, and human health. • most clearly seen in the aquatic environments • young of most species are more sensitive • At pH 5, most fish eggs cannot hatch. • At lower pH levels, some adult fish die.
Effects of Acid Rain • Acidic water • dissolves the nutrients and helpful minerals in the soil • washes them away before trees and other plants can use them to grow
Buffering Capacity • Acid rain primarily affects sensitive bodies of water • soils have a limited “buffering capacity” • Lakes and streams become acidic • In areas where buffering capacity is low, acid rain also releases aluminum from soils into lakes and streams • Aluminum is highly toxic to many species of aquatic organisms.
Mongolia Germany
Ozone – Two Faces • Stratosphere – Good Ozone • Blocks UV radiation • Hole caused by depletion due to CFC’s • Troposphere – Bad Ozone • Pollution • Photochemical smog • Eye irritant
Destroying Good Ozone • Chloroflourocarbons created in 1928 as non-toxic, non-flamable refrigerants • first produced commercially in the 1930's by DuPont • In 1974, a laboratory study demonstrated the ability of CFC's to breakdown Ozone in the presence of high frequency UV light • Cl + O3 -> ClO + O2 ClO + O3 ---> 2 O2 + Cl • In a 1985, a study summarized data that had been collected by the British Antartic Survey showing that ozone levels had dropped to 10% below normal January levels for Antarctica. • http://www.nas.nasa.gov/About/Education/Ozone/history.html
Destruction of Stratospheric Ozone • CFCs persist up in the atmosphere for decades • Models indicate that 75-85% of the observed ozone losses in the stratosphere since 1976 are the result of ozone depleting chemicals released in the early 1950s
Stratospheric Ozone • Winds isolate Antarctic air and allows stratospheric temperatures to drop and create ice crystals at high altitudes. • ozone and chlorine molecules are absorbed on the surfaces of these ice particles. • When sun returns in the spring and provides energy chlorine molecules are released
Harmful effects of UV radiation • Skin cancer • Cataracts and sun burning • Adverse impact on crops and animals • Alters photochemical reaction rates • Increases smog and surface layer ozone • Degradation of paints and plastic material
Montreal Protocol • An international treaty designed to protect the ozone layer • Phasing out production of number of substances believed to be responsible for ozone depletion • Effective January 1, 1989 • Five revisions • 1990 (London) • 1992 (Copenhagen) • 1995 (Vienna) • 1997 (Montreal) • 1999 (Beijing) • As a result CFC production fell 85%
Global Warming…What is it? • Global Warming refers to an average increase in the Earth's temperature, • Which in turn causes changes in climate • Caused by the GREENHOUSE EFFECT
Greenhouse Gases • The greenhouse gases contribute to holding heat inside our atmosphere. • They include: • carbon dioxide (CO2) • methane (CH4) • nitrous oxide (N2O) • chlorofluorocarbons (CFCs) • ozone (O3) • water vapor
Global Warming • Current Causes • Deforestation • Greenhouse Gases • Burning of Fossil Fuels • Main villain is currently Carbon Dioxide (CO2) • China leader (~21%) • US 2nd runner up (~19%)
Deforestation - US • About one half of the forests that covered the Earth are gone • Since 1600, 90% of the U.S. forests have been cleared away
Results of Deforestation • Loss of trees’ ability to remove CO2 • Decaying trees release CO2 and methane • Fallen trees are often burnt which releases CO2 • Deforestation the largest source of emissions in developing countries