Download
1 / 19
200 likes | 287 Views
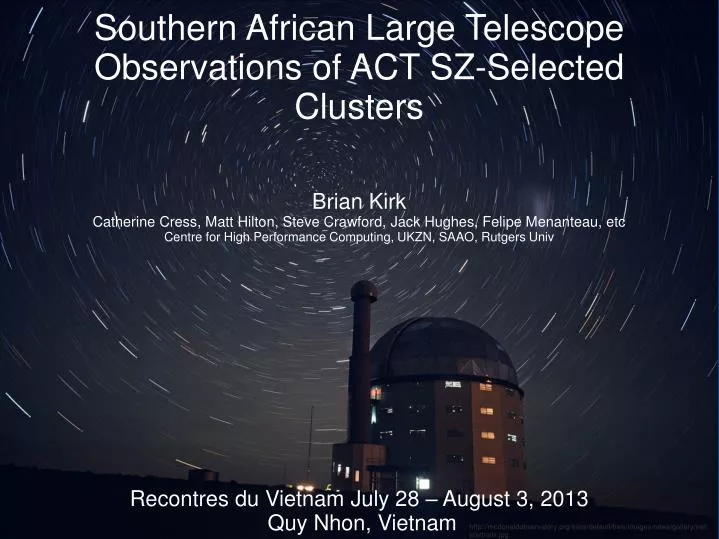
Brian Kirk Catherine Cress, Matt Hilton, Steve Crawford, Jack Hughes, Felipe Menanteau, etc Centre for High Performance Computing, UKZN, SAAO, Rutgers Univ Recontres du Vietnam July 28 – August 3, 2013 Quy Nhon, Vietnam.

E N D
Brian Kirk Catherine Cress, Matt Hilton, Steve Crawford, Jack Hughes, Felipe Menanteau, etc Centre for High Performance Computing, UKZN, SAAO, Rutgers Univ Recontres du Vietnam July 28 – August 3, 2013 Quy Nhon, Vietnam Southern African Large Telescope Observations of ACT SZ-Selected Clusters http://mcdonaldobservatory.org/sites/default/files/images/news/gallery/salt.startrails.jpg
Evolution of Structure through Time • Structure of galaxies, clusters of galaxies, super clusters, etc. form through gravitational collapse of density fluctuations seen in the CMB. • How structure evolves and how it appears to us depends on cosmological parameters. • Our goal is to sample galaxy clusters as a function of z to constrain these cosmological parameters. • w value has an affect on the number density of clusters over a given SZ detection threshold • w value of curve peak from top to bottom: -1, -0.6, -0.3, 0 Haiman et al (2001)
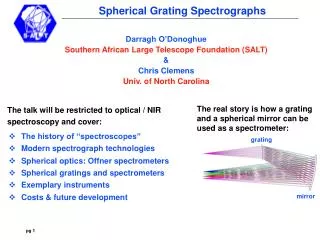
Sunyaev-Zeldovich effect: • Hot gas (107K) exists in galaxy cluster environments. • CMB photons colliding with the hot gas get up-scattered to higher frequencies by the inverse Compton effect. • Hot e-’s give up their energy to radio photons. • ACT maps show galaxy clusters as holes in the CMB sky at radio λ ’s and as bright patches at mm λ’s. Visible X-ray
Why we do optical follow-up • Sunyaev Zel-Dovich – Mass Relation (YM relation) • Calibrate YM relation with cluster masses • Using the cluster locations identified by ACT, we measure redshifts of galaxies and velocity dispersions of the cluster so masses can be estimated
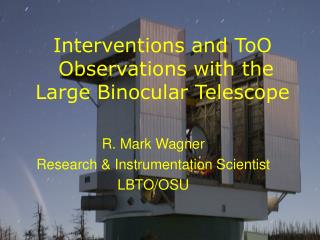
SALT Specs • 11m primary composed of 91 hexagonal mirrors • Fixed altitude • Spherical mirror • Robert Stobie Spectrograph (RSS) • It is the largest telescope in the Southern Hemisphere http://images2.wikia.nocookie.net/__cb20110216160051/saltsutherland/images/6/61/Primary.jpg http://kelltrill.files.wordpress.com/2011/03/set-02-03.jpg
RSS Multi Object Spectroscopy • 3 masks per cluster • 20-30 galaxies per mask • 2 exposures per mask • 1000s exposures
SALT Spectra • Once spectra is reduced it is correlated with galaxy templates. • 7 different galaxy templates from SDSS • Of the spectra acquired, only those with multiple line (H+K) confirmations were selected for velocity dispersion and mass estimates Blue line is spectra, green line is template
Cluster J0320 Mask 2 Galaxy Members Preliminary results show:
YM Relation Results • SALT observations will help us to characterize the scaling relation between SZ signal and cluster mass – as well as improving our understanding of this relation's redshift evolution • SALT observations are ongoing through 2013. Y200 –dynamical mass relation derived from 2010B Gemini/VLT observations of southern ACT clusters (solid line, Sifon et al., 2012). The slope of the relation is consistent with the self-similar prediction; more observations are needed to improve this result and constrain the evolution with redshift of the relation. Note the Battaglia et al. result is from numerical simulations, and the Planck result is from stacking clusters at much lower redshifts than the ACT sample.
In Summary * cluster counts as a function of redshift constrain cosmology * need to measure cluster masses accurately * using SALT to collect spectra of galaxy clusters detected by ACT * measuring mass of clusters using velocity dispersions to help calibrate YM relation