Download
1 / 24
240 likes | 326 Views
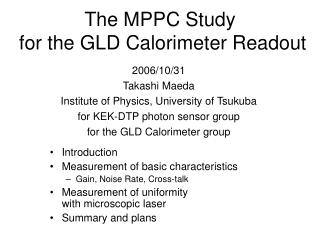
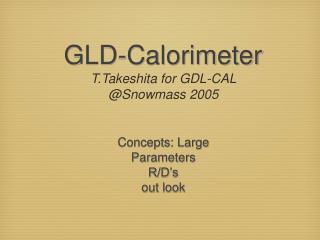
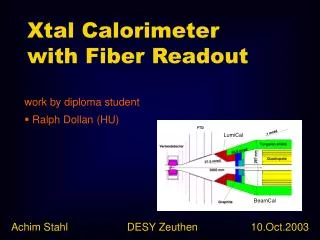
Performance of 1600-pixel MPPC for the GLD Calorimeter Readout. Jan. 30(Tue.) Korea-Japan Joint Meeting @ Shinshu Univ. Takashi Maeda ( Univ. of Tsukuba) for the GLD Calorimeter Group. The Multi-Pixel Photon Counter (MPPC) … Novel photon sensor that used for GLD calorimeter readout.

E N D
Performance of 1600-pixel MPPCfor the GLD Calorimeter Readout Jan. 30(Tue.) Korea-Japan Joint Meeting @ Shinshu Univ. Takashi Maeda(Univ. of Tsukuba) for the GLD Calorimeter Group
The Multi-Pixel Photon Counter (MPPC) …Novel photon sensor that used for GLD calorimeter readout 1600-pixel MPPC Si Resistor Guard ring
The Multi-Pixel Photon Counter (MPPC) • 20 improved samples in last October and 400 samples in last December. • Very compact plastic packagefor Beam Test @ DESY 4 mm 3 mm 1.3 mm • Old Sample • Can package • ---Improved Point--- • Higher Gain • Lower Noise rate • Package becomes compact • etc… 1 x 1 mm
Pulse Shape 1 p.e. 2 p.e.
Measurement of Basic Characteristics • Evaluate 1600-pixel MPPC performance as a function of Bias Voltage and Temperature • Gain, Noise rate, Cross-talk, P.D.E.Set up Blue LED MPPC Thermostatic chamber
Gain • 30oC • 25oC • 20oC • 15oC • 10oC • 0oC • -20oC Pedestal peak d 1 p.e. peak 2 p.e. peak S : ADC Sensitivity = 0.25 pC/ADCcount A : Amp gain = 63 e : electron charge = 1.6 x10⁻¹⁹ C C : Pixel Capacitance V0: Breakdown voltage
V0 with Temperature Variation • V0 is linear to temperature • DV = VBias– V0(T) is sensitive to temperature • Most of MPPC performances are affected by temperature change • Must be improved DV0/DT = (56.0 ± 0.1)mV/oC C : Pixel Capacitance V0: Breakdown voltage
Dark noise : Avalanche amplificationby thermal electron Noise rate is lower in lower DV( = Vbias– V0) and temperature Noise Rate • 30 oC • 25 oC • 20 oC • 15 oC • 10 oC • 0 oC • -20 oC Threshold 0.5 p.e. 0.5 p.e. Threshold 1.5 p.e. Threshold
Cross-talk : The cross-talk to adjacent pixels is caused by photons created in an avalanche. 2 pixels fired signals in dark noises are caused by cross-talk Cross-talk probabilityis not sensitive to temperature change Cross-talk Probability • 30 oC • 25 oC • 20 oC • 15 oC • 10 oC • 0 oC • -20 oC
Photon Detection Efficiency (P.D.E) ~ Detection probability for single photon injection • Q.E. : e- h+ pair production probability for single photon injection ( Quantum Efficiency ) • eGeiger : Avalanche amplification probability from single p.e. • egeom : Fraction of sensitive region in a sensor ( Geometrical Efficiency) Measurement method • Compare # of p.e. of MPPC with # of p.e. of PMT (Reference) LED WLSF MPPC PMT ~ 16 % 0.5 mm f Pin-hole
P.D.E. Result ~ 6.3 % P.D.E. of PMT 6.3 % uncertainty comes from estimation of PMT’s P.D.E
Summary • We are evaluating 1600-pixel MPPC characteristic for the GLD calorimeter readout • Gain, Noise rate are sufficient for our requirement • Breakdown voltage is sensitive to temperature change • Have to monitor the temperature • Photon Detection Efficiency is higher than PMT Plans • Response curve (Input light-yield vs. Output signal) • Evaluate Uniformity in the sensor • Measure long-term stability • Figure out radiation damage effect and magnetic field stability
Old sample results - Gain • 30oC • 25oC • 20oC • 15oC • 10oC • 0oC • -20oC V0=aT+b a = (5.67 ± 0.03) x10-2 V/oC b = 66.2 ± 0.1 V
Vbias – V0(T) [V] Old sample results – Noise rate • 30oC • 25oC • 20oC • 15oC • 10oC • 0oC • -20oC
・30℃ ・25℃ ・20℃ ・15℃ ・10℃ ・0℃ ・-20℃ Vbias – V0(T) [V] Old sample results – Cross-talk The cross-talk to adjacent pixels is caused by photons created in an avalanche. Cross-talk probability ismeasured from dark noise rates : • Cross-talk probability looks stable with temperature inVbias– V0 < 2.5V.
Delay Gate Generator Clock Generator Set up PC Gate Signal input AMP *63 Green LED MPPC WLSF Voltage source Voltage source Stage PMT Thermo-static chamber HV
Light yeild measurement( with noise and cross-talk subtraction) • Measure light yeild of LED light pulse • Fit ADC distributon • Supposed signals are dominated by Poisson statistics • Count number of events below 0.5 p.e. threshold ( both LED on and off ) 0.5 p.e. threshold pedestal Events 0.5 p.e. threshold pedestal Events
Calculation of Np.e. • f(n,μ) is Poisson distribution function • μ is Expectated number of Np.e. • f(0,μLED on), f(0,μLED off ) are probability of 0 p.e. • f(0,μnoise) = NLED off/ NLED off = e-μnoise • f(0,μLED on) = NLED on / NLED on =e-μLED on • f(0,μLED on) = f(0, μ+μnoise) = f(0,μ) × f(0,μnoise) f(0,μ) =f(0,μLED on) / f(0,μnoise) = e-μ μ = -ln( f(0,μ) ) all pedestal pedestal all
WLS Fiber Y-11 Reference : JLCストリップ・ファイバー電磁カロリメータの性能研究 Katsumi Sekiguchi March. 2003
Mean of QE for 1 p.e. QE × relative light yeild on each wave length ∑( QE × relative light yeild on each wave length ) = Mean of QE for 1 p.e. ~16.7 %
Response / Correction curves ( with small cross-talk ) R(p;Npe) R-1(p;Nfired) p=0.1 p=0.1 p=0 (no cross-talk) Response curve Correction curve